Download
1 / 42
420 likes | 425 Views
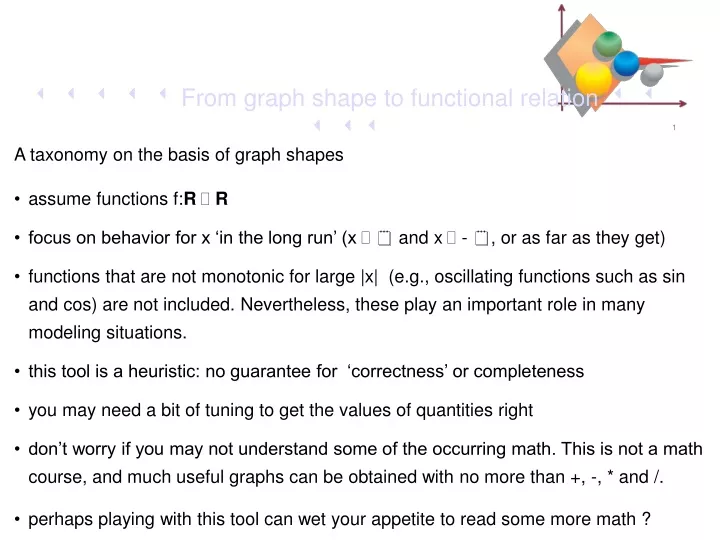
A Core Course on Modeling. Week 4-Dealing with mathematical relations. From graph shape to functional relation . 1. A taxonomy on the basis of graph shapes assume functions f: R R focus on behavior for x ‘in the long run’ (x and x - , or as far as they get )

E N D
A Core Course on Modeling Week 4-Dealing with mathematical relations From graph shape to functional relation 1 • A taxonomy on the basis of graph shapes • assume functions f:R R • focus on behavior for x ‘in the long run’ (x and x - , or as far as they get) • functions that are not monotonic for large |x| (e.g., oscillating functions such as sin and cos) are not included. Nevertheless, these play an important role in many modeling situations. • this tool is a heuristic: no guarantee for ‘correctness’ or completeness • you may need a bit of tuning to get the values of quantities right • don’t worry if you may not understand some of the occurring math. This is not a math course, and much useful graphs can be obtained with no more than +, -, * and /. • perhaps playing with this tool can wet your appetite to read some more math ?
A Core Course on Modeling Week 4-Dealing with mathematical relations From graph shape to functional relation 2
A Core Course on Modeling Week 4-Dealing with mathematical relations From graph shape to functional relation 3 Behavior Suggested form Parameters How to fit Example Remarks Linear, increasing y = ax + b, a > 0 a: slope with the +x axis; b: intercept with the y-axis linear least squares (http://en.wikipedia.org/wiki/Linear_least_squares_(mathematics) ); The world record time on 100 m sprint as a function of time (this example shows the limitations of extrapolating simple models; see Edwards & Hamson, page 10 and further)
A Core Course on Modeling Week 4-Dealing with mathematical relations From graph shape to functional relation 4 Behavior Suggested form Parameters How to fit Example Remarks Linear, decreasing y = ax + b, a < 0 a: slope with the +x axis; b: intercept with the y-axis linear least squares (http://en.wikipedia.org/wiki/Linear_least_squares_(mathematics) ); The world record time on 100 m sprint as a function of time (this example shows the limitations of extrapolating simple models; see Edwards & Hamson, page 10 and further)
A Core Course on Modeling Week 4-Dealing with mathematical relations From graph shape to functional relation 5 Behavior Suggested form Parameters How to fit Example Remarks Piecewise linear (tent shape, sharp bend) y = a abs(x - x0) + b, a < 0 a: slope with the +x axis; b: height of the top; x0 : location of the top first estimate x0; next linear least squares to find a and b (http://en.wikipedia.org/wiki/Linear_least_squares_(mathematics) ); Accurate measurements using compensation method (e.g., Wheatstone bridge for measuring resistance, capacity, inductance) This assumes that the slopes of the left and right lines, in absolute value, are equal. If not, split the domain and try to different linear equations.
A Core Course on Modeling Week 4-Dealing with mathematical relations From graph shape to functional relation 6 Behavior Suggested form Parameters How to fit Example Remarks Piecewise linear (V shape, sharp bend) y = a abs(x - x0) + b, a > 0 a: slope with the +x axis; b: depth of the valley; x0 : location of the valley first estimate x0; next linear least squares to find a and b (http://en.wikipedia.org/wiki/Linear_least_squares_(mathematics) ); Accurate measurements using compensation method (e.g., Wheatstone bridge for measuring resistance, capacity, inductance) This assumes that the slopes of the left and right lines, in absolute value, are equal. If not, split the domain and try to different linear equations.
A Core Course on Modeling Week 4-Dealing with mathematical relations From graph shape to functional relation 7 Behavior Suggested form Parameters How to fit Example Remarks Horizontal asymptote left; unbounded increase for x y = a exp (b x) + c, a > 0, b > 0 c determines the height of the asymptote; b determines the rate of increase for increasing x; a stretches or compresses the graph vertically first estimate c; next take log(y-c) =b x + log(a) and estimate b and log(a) using linear least squares. Proportional, unbounded growth, e.g. financial assets (compound interest), populations, bacteria or virus colonies. For bounded growth, see e.g. logistic function See: http://mathworld.wolfram.com/LeastSquaresFittingExponential.html
A Core Course on Modeling Week 4-Dealing with mathematical relations From graph shape to functional relation 8 Behavior Suggested form Parameters How to fit Example Remarks Horizontal asymptote right; unbounded increase for x - y = a exp (b x) + c, a > 0, b < 0 c determines the height of the asymptote; b determines the rate of increase for decreasing x; a stretches or compresses the graph vertically first estimate c; next take log(y-c) = b x + log(a) and estimate b and log(a) using linear least squares. Proportional decrease or decay; absorption (e.g., light) in a medium (x=thickness), radioactive decay (x=time), something cooling down or getting diluted over time. See: http://mathworld.wolfram.com/LeastSquaresFittingExponential.html
A Core Course on Modeling Week 4-Dealing with mathematical relations From graph shape to functional relation 9 Behavior Suggested form Parameters How to fit Example Remarks Horizontal asymptote left; unbounded decrease for x y = a exp (b x) + c, a < 0, b > 0 c determines the height of the asymptote; b determines the rate of decrease for increasing x; a stretches or compresses the graph vertically first estimate c; next take log(y-c) =b x + log(a) and estimate b and log(a) using linear least squares. Proportional unbounded negative growth, e.g. financial losses (interest on loan, state debt) See: http://mathworld.wolfram.com/LeastSquaresFittingExponential.html
A Core Course on Modeling Week 4-Dealing with mathematical relations From graph shape to functional relation 10 Behavior Suggested form Parameters How to fit Example Remarks Horizontal asymptote right; unbounded decrease for x - y = a exp (b x) + c, a < 0, b < 0 c determines the height of the asymptote; b determines the rate of decrease for decreasing x; a stretches or compresses the graph vertically first estimate c; next take log(y-c) =b x + log(a) and estimate b and log(a) using linear least squares. Proportional decrease or decay of a negative value (e.g., a debt that is payed back over time with a fixed fraction of the current debt) See: http://mathworld.wolfram.com/LeastSquaresFittingExponential.html
A Core Course on Modeling Week 4-Dealing with mathematical relations From graph shape to functional relation 11 Behavior Suggested form Parameters How to fit Example Remarks Vertical asymptote left; unbounded increase for x y = a log ( b (x-c) ), a > 0, b > 0, x > c c determines the location of the asymptote; a determines the rate of increase; b stretches or compresses the graph horizontally first estimate c; set x’= x-c. Next set exp(y) = exp(a) + bx’; use linear least squares estimate to find b and exp(a). Perception (e.g., perceived loudness is proportional to the log of the air pressure); signal processing (dB); computing science (execution time of efficient search algorithms sometimes grows with log of data size) See: http://mathworld.wolfram.com/LeastSquaresFittingLogarithmic.html
A Core Course on Modeling Week 4-Dealing with mathematical relations From graph shape to functional relation 12 Behavior Suggested form Parameters How to fit Example Remarks Vertical asymptote right; unbounded increase for x - y = a log ( b (x-c) ), a > 0, b < 0, x < c c determines the location of the asymptote; a determines the rate of increase; b stretches or compresses the graph horizontally first estimate c; set x’= x-c. Next set exp(y) = exp(a) + bx’; use linear least squares estimate to find b and exp(a). (no example) See: http://mathworld.wolfram.com/LeastSquaresFittingLogarithmic.html
A Core Course on Modeling Week 4-Dealing with mathematical relations From graph shape to functional relation 13 Behavior Suggested form Parameters How to fit Example Remarks Vertical asymptote left; unbounded decrease for x y = a log ( b (x-c) ), a < 0, b > 0, x > c c determines the location of the asymptote; a determines the rate of increase; b stretches or compresses the graph horizontally first estimate c; set x’= x-c. Next set exp(y) = exp(a) + bx’; use linear least squares estimate to find b and exp(a). Signal processing: components with amplification factor r < 1 are often characterized by –log( r ); the effect of combining such amplifiers (attenuators) amounts to adding their log-amplification rates See: http://mathworld.wolfram.com/LeastSquaresFittingLogarithmic.html
A Core Course on Modeling Week 4-Dealing with mathematical relations From graph shape to functional relation 14 Behavior Suggested form Parameters How to fit Example Remarks Vertical asymptote right; unbounded decrease for x - y = a log ( b (x-c) ), a < 0, b < 0, x < c c determines the location of the asymptote; a determines the rate of increase; b stretches or compresses the graph horizontally first estimate c; set x’= x-c. Next set exp(y) = exp(a) + bx’; use linear least squares estimate to find b and exp(a). (no example) See: http://mathworld.wolfram.com/LeastSquaresFittingLogarithmic.html
A Core Course on Modeling Week 4-Dealing with mathematical relations From graph shape to functional relation 15 Behavior Suggested form Parameters How to fit Example Remarks Unbounded increase both forx and for for x - y = a x2 + b x + c, a > 0 a determines curvature; x = -b/2a is the location of the symmetry axis; c determines vertical positioning of the graph first estimate apex (=lowest point), (xa,ya); find point (xa+p,yshift) for arbitrary p. Then a = (yshift-ya)/p2; b = -2axa; c = ya+b2/4a Free falling objects have parabolic trajectories; stopping distance for braking cars with speed v is ~v2; air resistance on object with speed v approximately ~ v2; potential energy for oscillating system with amplitude u is ~u2; area and moment of inertia of a surface with characteristic dimension r is ~r2. Any even degree polynomial has the behavior of unbounded increase or decrease both left and right; they can have inflection points and therefore multiple local extrema. For large |x|, only the highest power dominates, so left branch and right branch tend to be mirror symmetric for large |x|. For small x, x>0, parabola resembles x log (x).
A Core Course on Modeling Week 4-Dealing with mathematical relations From graph shape to functional relation 16 Behavior Suggested form Parameters How to fit Example Remarks Unbounded decrease both forx and for for x - y = a x2 + b x + c, a < 0 a determines curvature; x = -b/2a is the location of the symmetry axis; c determines vertical positioning of the graph first estimate apex (=highest point), (xa,ya); find point (xa+p,yshift) for arbitrary p. Then a = (yshift-ya)/p2; b = -2axa; c = ya+b2/4a Free falling objects have parabolic trajectories; stopping distance for braking cars with speed v is ~v2; air resistance on object with speed v approximately ~ v2; potential energy for oscillating system with amplitude u is ~u2; area and moment of inertia of a surface with characteristic dimension r is ~r2. Any even degree polynomial has the behavior of unbounded increase or decrease both left and right; they can have inflection points and therefore multiple local extrema. For large |x|, only the highest power dominates, so left branch and right branch tend to be mirror symmetric for large |x|. For small x, x>0, parabola resembles x log (x).
A Core Course on Modeling Week 4-Dealing with mathematical relations From graph shape to functional relation 17 Behavior Suggested form Parameters How to fit Example Remarks Asymptotic increase both for decreasing and for increasing x y = a + b tan 2 (c(x-x0)), b > 0 The location of the asymptotes determine c and x0 The height of the apex (lowest point) is a; b determines the steepness. Let xa1 and xa2 the locations of the asymptotes. Then set x0=(xa1+xa2)/2; c=/(xa2-xa1). The height of the apex is a; b tunes the steepness. No known examples. Alternative: y = a + b / (x-x0)(x-x1). The x - locations of the asymptotes are the zeroes of the denominator.
A Core Course on Modeling Week 4-Dealing with mathematical relations From graph shape to functional relation 18 Behavior Suggested form Parameters How to fit Example Remarks Asymptotic decrease both for decreasing and for increasing x y = a + b tan 2 (c(x-x0)), b < 0 The location of the asymptotes determine c and x0 The height of the apex (highest point) is a; b determines the steepness. Let xa1 and xa2 the locations of the asymptotes. Then set x0=(xa1+xa2)/2; c=/(xa2-xa1). The height of the apex is a; b tunes the steepness. No known examples. Alternative: y = a + b / (x-x0)(x-x1). The x - locations of the asymptotes are the zeroes of the denominator.
A Core Course on Modeling Week 4-Dealing with mathematical relations From graph shape to functional relation 19 Behavior Suggested form Parameters How to fit Example Remarks Unbounded increase for x and unbounded decrease for for x - y = a x3 + b x2 + c x + d, a > 0 or a determines behavior for |x| sufficiently large. If b2 > 3ac, there are two local extrema; if b2 = 3ac there is a horizontal tangent, and if b2 < 3ac, the curve is monotonic. d determines vertical positioning of the graph. Brute-force method: substitute at least 4 points (xi,yi) into y=ax3+bx2+cx+d and solve linear set of equations for a,b,c,d in least-squares sense. For all coefficients ≠0: no common applications known. For only a ≠ 0: the volume or the mass of an object, given its characteristic dimension. Although the cubic function (or higher, odd-degree polynomial functions) have little practical application, cubic parameter curves x=Fx(t), y=Fy(t) , 0t 1 (so called splines) form the working horse of most of computer aided geometric design: since they have 4 parameters, they can satisfy two continuity constraints on both ends (values and tangents), and form a smooth curve consisting of piecewise cubic curves.
A Core Course on Modeling Week 4-Dealing with mathematical relations From graph shape to functional relation 20 Behavior Suggested form Parameters How to fit Example Remarks Unbounded decrease for x and unbounded increase for for x - y = a x3 + b x2 + c x + d, a < 0 or a determines behavior for |x| sufficiently large. If b2 > 3ac, there are two local extrema; if b2 = 3ac there is a horizontal tangent, and if b2 < 3ac, the curve is monotonic. d determines vertical positioning of the graph. Brute-force method: substitute at least 4 points (xi,yi) into y=ax3+bx2+cx+d and solve linear set of equations for a,b,c,d in least-squares sense. For all coefficients ≠0: no common applications known. For only a ≠ 0: the volume or the mass of an object, given its characteristic dimension. Although the cubic function (or higher, odd-degree polynomial functions) have little practical application, cubic parameter curves x=Fx(t), y=Fy(t) , 0t 1 (so called splines) form the working horse of most of computer aided geometric design: since they have 4 parameters, they can satisfy two continuity constraints on both ends (values and tangents), and form a smooth curve consisting of piecewise cubic curves.
A Core Course on Modeling Week 4-Dealing with mathematical relations From graph shape to functional relation 21 Behavior Suggested form Parameters How to fit Example Remarks Asymptotic increase for increasing x, asymptotic decrease for decreasing x y = c tan (a(x-b)) + d, ac > 0 a stretches or compresses the curve horizontally; b shifts the curve to the left or the right; a and c together determine the steepness in the inflection point; d is a vertical offset First find a and b such that asymptotes are on the right locations, use that tan(x) has asymptotes for /2 and -/2. Next adjust c to get the steepness right; finally adjust d to get the intersection with x-axis right. tan functions often occur in relation to geometric problems involving angles or ratios of lengths. E.g., find the height of a building from the length of its shadow and the angle of the sun above the horizon. An alternative parameterization is, for instance, y = x/((x-x0)(x-x1)). This function has two vertical asymptotes, for x=x0 and x1 respectively. However, it also has horizontal asymptotes; in our taxonomy it would therefore classify as ‘saturation both left and right, increasing or decreasing everywhere’
A Core Course on Modeling Week 4-Dealing with mathematical relations From graph shape to functional relation 22 Behavior Suggested form Parameters How to fit Example Remarks Asymptotic decrease for increasing x, asymptotic increase for decreasing x y = c tan (a(x-b)) + d, ac < 0 a stretches or compresses the curve horizontally; b shifts the curve to the left or the right; a and c together determine the steepness in the inflection point; d is a vertical offset First find a and b such that asymptotes are on the right locations, use that tan(x) has asymptotes for /2 and -/2. Next adjust c to get the steepness right; finally adjust d to get the intersection with x-axis right. tan functions often occur in relation to geometric problems involving angles or ratios of lengths. E.g., find the height of a building from the length of its shadow and the angle of the sun above the horizon. An alternative parameterization is, for instance, y = x/((x-x0)(x-x1)). This function has two vertical asymptotes, for x=x0 and x1 respectively. However, it also has horizontal asymptotes; in our taxonomy it would therefore classify as ‘saturation both left and right, increasing or decreasing everywhere’
A Core Course on Modeling Week 4-Dealing with mathematical relations From graph shape to functional relation 23 Behavior Suggested form Parameters How to fit Example Remarks Asymptotic increase for decreasing x, saturating increase for increasing x several; simplest in use: y = c((a/x)12-2(a/x)6), a > 0, c > 0, x > 0 c is a scale factor, determining the depth of the ‘dip’; a is the x-value for which the minimum is reached. Find the location of the dip; its x-coordinate is a. Next substitute the y value of the minimum to adjust c. The force between particles (atoms, molecules) if often a combination of attraction at long distance andd repulsion at short distance. This form for the interaction was proposed by, and named after E. Lennard-Jones. http://en.wikipedia.org/wiki/Lennard-Jones_potential
A Core Course on Modeling Week 4-Dealing with mathematical relations From graph shape to functional relation 24 Behavior Suggested form Parameters How to fit Example Remarks Asymptotic increase for increasing x, saturating increase for decreasing x several; simplest in use: y = c((a/x)12-2(a/x)6), a > 0, c > 0, x < 0 c is a scale factor, determining the depth of the ‘dip’; a is the x-value for which the minimum is reached. Find the location of the dip; its x-coordinate is a. Next substitute the y value of the minimum to adjust c. (uncommon: in physical applications, x is a distance and distances cannot be negative)
A Core Course on Modeling Week 4-Dealing with mathematical relations From graph shape to functional relation 25 Behavior Suggested form Parameters How to fit Example Remarks Asymptotic decrease for decreasing x, saturating decresae for increasing x several; simplest in use: y = c((a/x)12-2(a/x)6), a > 0, c < 0, x > 0 c is a scale factor, determining the depth of the ‘dip’; a is the x-value for which the minimum is reached. Find the location of the top; its x-coordinate is a. Next substitute the y value of the minimum to adjust c. (no example)
A Core Course on Modeling Week 4-Dealing with mathematical relations From graph shape to functional relation 26 Behavior Suggested form Parameters How to fit Example Remarks Asymptotic decrease for increasing x, saturating decrease for decreasing x several; simplest in use: y = c((a/x)12-2(a/x)6), a > 0, c < 0, x < 0 c is a scale factor, determining the depth of the ‘dip’; a is the x-value for which the minimum is reached. Find the location of the top; its x-coordinate is a. Next substitute the y value of the minimum to adjust c. (no example)
A Core Course on Modeling Week 4-Dealing with mathematical relations From graph shape to functional relation 27 Behavior Suggested form Parameters How to fit Example Remarks Linear decrease for decreasing x, saturating decrease for increasing x y = C x * logistic curve (x), where logistic curve 0 for increasing x; C > 0 C is overall scale factor; should be 1 if x and y are in same units. Logistic curve ranges from +1 to 0 for increasing x Find overall scale factor C from slope left hand part; next divide by Cx and find parameters for logistic curve as described with logistic curve. Income as a function of selling price: if the price is to low, income is low despite large volume; if the price is too high, market (share) will be too small.
A Core Course on Modeling Week 4-Dealing with mathematical relations From graph shape to functional relation 28 Behavior Suggested form Parameters How to fit Example Remarks Linear decrease for increasing x, saturating decrease for decreasing x y = C x * logistic curve (x), where logistic curve 0 for decreasing x; C < 0 C is overall scale factor; should be 1 if x and y are in same units. Logistic curve ranges from +1 to 0 for decreasing x Find overall scale factor C from slope left hand part; next divide by Cx and find parameters for logistic curve as described with logistic curve. (no example)
A Core Course on Modeling Week 4-Dealing with mathematical relations From graph shape to functional relation 29 Behavior Suggested form Parameters How to fit Example Remarks Linear increase for decreasing x, saturating increase for increasing x y = C x * logistic curve (x), where logistic curve 0 for increasing x; C < 0 C is overall scale factor; should be 1 if x and y are in same units. Logistic curve ranges from +1 to 0 for increasing x Find overall scale factor C from slope left hand part; next divide by Cx and find parameters for logistic curve as described with logistic curve. (no example)
A Core Course on Modeling Week 4-Dealing with mathematical relations From graph shape to functional relation 30 Behavior Suggested form Parameters How to fit Example Remarks Linear increase for increasing x, saturating increase for decreasing x y = C x * logistic curve (x), where logistic curve 0 for decreasing x; C > 0 C is overall scale factor; should be 1 if x and y are in same units. Logistic curve ranges from +1 to 0 for decreasing x Find overall scale factor C from slope left hand part; next divide by Cx and find parameters for logistic curve as described with logistic curve. (no example)
A Core Course on Modeling Week 4-Dealing with mathematical relations From graph shape to functional relation 31 Behavior Suggested form Parameters How to fit Example Remarks saturation; decreasing for decreasing x; increasing for increasing x. When monotonous, a logistic curve is a likely candidate. y = 1/(1+exp(-x)) Standard version has no parameters: asymptotes for y=0 and y=1. Standard inflection point for x=0 and slope 1. For arbitrary asymptotes, inflection point and slope, use Richards generalised logistic curve; see http://en.wikipedia.org/wiki/Generalised_logistic_curve Applications in ecology (bounded population growth), chemistry (autocatalyse), neural networks, medicine (tumor growth), physics (Fermi distribution), economy (price elasticity) Depending on the application, other parametrizations can be y=a arctan (bx +c)+d, or piecewise linear (ramp function). If the function can have a vertical asymptote (that is, is not monotonous), a two-branch hyperbola like y = 1/x could be tried.
A Core Course on Modeling Week 4-Dealing with mathematical relations From graph shape to functional relation 32 Behavior Suggested form Parameters How to fit Example Remarks saturation; increasing for decreasing x; decreasing for increasing x. When monotonous, a logistic curve is a likely candidate. y = 1/(1+exp(x)) Standard version has no parameters: asymptotes for y=0 and y=1. Standard inflection point for x=0 and slope -1. For arbitrary asymptotes, inflection point and slope, use Richards generalised logistic curve; see http://en.wikipedia.org/wiki/Generalised_logistic_curve Applications in neural networks, medicine (tumor growth), physics (Fermi distribution), economy (price elasticity). (Notice: not in ecology or demography; when species get extinct, there is no gradual asymptotic decay for increasing x (=time)). Depending on the application, other parametrizations can be y=a arctan (bx +c)+d, or piecewise linear (ramp function). If the function can have a vertical asymptote (that is, is not monotonous), a two-branch hyperbola like y = 1/x could be tried.
A Core Course on Modeling Week 4-Dealing with mathematical relations From graph shape to functional relation 33 Behavior Suggested form Parameters How to fit Example Remarks vertical asymptote for increasing x, saturating decrease for decreasing x y = a+b/(x-c), x < c, b < 0 a and c define asymptotes; b defines slope (left branch of orthogonal hyperbola). Find vertical asymptote; this defines c. Find horizontal asymptote; this defines a. Slope is controlled by b; sign of b defines which the quadrants. (no example)
A Core Course on Modeling Week 4-Dealing with mathematical relations From graph shape to functional relation 34 Behavior Suggested form Parameters How to fit Example Remarks vertical asymptote for decreasing x, saturating decrease for increasing x y = a+b/(x-c), x > c, b > 0 a and c define asymptotes; b defines slope (left branch of orthogonal hyperbola). Find vertical asymptote; this defines c. Find horizontal asymptote; this defines a. Slope is controlled by b; sign of b defines which the quadrants. In physics, the product of P and V (pressure and volume) for an amount of gas with constant temperature is constant. Both are non-negative, so only one branch of the hyperbola. Also phyics: gravity or electrostatic potential for a point mass / charge decreases with 1/distance.
A Core Course on Modeling Week 4-Dealing with mathematical relations From graph shape to functional relation 35 Behavior Suggested form Parameters How to fit Example Remarks vertical asymptote for increasing x, saturating increase for decreasing x y = a+b/(x-c), x < c, b > 0 a and c define asymptotes; b defines slope (left branch of orthogonal hyperbola). Find vertical asymptote; this defines c. Find horizontal asymptote; this defines a. Slope is controlled by b; sign of b defines which the quadrants. (no example)
A Core Course on Modeling Week 4-Dealing with mathematical relations From graph shape to functional relation 36 Behavior Suggested form Parameters How to fit Example Remarks vertical asymptote for decreasing x, saturating increase for increasing x y = a+b/(x-c), x > c, b < 0 a and c define asymptotes; b defines slope (left branch of orthogonal hyperbola). Find vertical asymptote; this defines c. Find horizontal asymptote; this defines a. Slope is controlled by b; sign of b defines which the quadrants. (no example)
A Core Course on Modeling Week 4-Dealing with mathematical relations From graph shape to functional relation 37 Behavior Suggested form Parameters How to fit Example Remarks monotonically increase for increasing x, decrease with decreasing x, with inflection point, no saturation y = (x-a) c + b, c < 1. For y to exist for x < a, c must be 1/odd a and b determine horizontal and vertical positioning, respectively. c determines curvature: for c closer to 1, the graph closer resembles a straight line. if the curve is point symmetric, a and b follow from the centre of symmetry. Let x’ = x-a, y’ = y-b. log(y’) = c log(x’), so the value of c follows from plotting on semi-log scale. For c = 1/3, a=b=0: characteristic dimension of an object with volume x Compare with y=x1/2=x only defined for x>0. Applications of square root: mechanics (fall time of a point mass for given height); applications involving Pythagoras’ theorem; characteristic dimension of a surface with given area.
A Core Course on Modeling Week 4-Dealing with mathematical relations From graph shape to functional relation 38 Behavior Suggested form Parameters How to fit Example Remarks monotonically decrease for increasing x, increase with decreasing x, with inflection point, no saturation y = - (x-a) c + b, c < 1. For y to exist for x < a, c must be 1/odd a and b determine horizontal and vertical positioning, respectively. c determines curvature: for c closer to 1, the graph closer resembles a straight line. if the curve is point symmetric, a and b follow from the centre of symmetry. Let x’ = x-a, y’ = y-b. log(y’) = c log(x’), so the value of c follows from plotting on semi-log scale. (no example)
A Core Course on Modeling Week 4-Dealing with mathematical relations From graph shape to functional relation 39 Behavior Suggested form Parameters How to fit Example Remarks saturation both left and right, decreasing both for decreasing and for increasing x; (1) no vertical asymptotes y= a exp (-(x-b)2/2c2) (Gaussian), or y = a / (1+(x-b)2/2c2) (Lorentzian), a>0 b is location of maximum; c relates to width of half maximum; a is height of maximum. for the Gaussian, first estimate b (=location of top) and a (=height). Next, estimate the inflection point. c is distance between the inflection points / 2. Gaussian: statistics, normal distribution; Lorentzian: distribution of energy in spectra, forced resonance; geometric distribution of light from a point source over a surface, not containing that light source. The Lorentzian has a ‘thicker’ tail than the Gaussian. It counts as a pathological distribution in statistics, because it has no mean and its variance is infinity.
A Core Course on Modeling Week 4-Dealing with mathematical relations From graph shape to functional relation 40 Behavior Suggested form Parameters How to fit Example Remarks saturation both left and right, decreasing both for decreasing and for increasing x; (2) vertical asymptote y = 1 / ((x-b)2/2c2) b is location of vertical asymptote; c relates to width of ‘peak’ Distribution of light from a point source over a surface containing the light source
A Core Course on Modeling Week 4-Dealing with mathematical relations From graph shape to functional relation 41 Behavior Suggested form Parameters How to fit Example Remarks saturation both left and right, increasing both for decreasing and for increasing x; (1) no vertical asymptotes y= a exp (-(x-b)2/2c2) (Gaussian), or y = a / (1+(x-b)2/2c2) (Lorentzian), a<0 b is location of minimum; c relates to width of half minimum; a is height of minimum. for the Gaussian, first estimate b (=location of minimum) and a (=height). Next, estimate the inflection point. c is distance between the inflection points / 2. (no example)
A Core Course on Modeling Week 4-Dealing with mathematical relations From graph shape to functional relation 42 Behavior Suggested form Parameters How to fit Example Remarks saturation both left and right, increasing both for decreasing and for increasing x; (2) vertical asymptote y = -1 / ((x-b)2/2c2) b is location of vertical asymptote; c relates to width of ‘peak’ (no example)