Download
1 / 43
450 likes | 708 Views
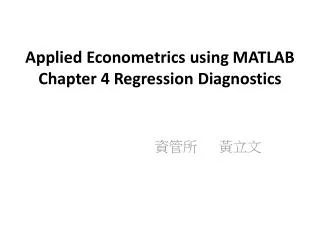
Applied Econometrics using MATLAB Chapter 4 Regression Diagnostics. 資管所 黃立文. Introduction. The first section of this chapter introduces functions for diagnosing and correcting collinearity problems.

E N D
Applied Econometrics using MATLABChapter 4 Regression Diagnostics 資管所黃立文
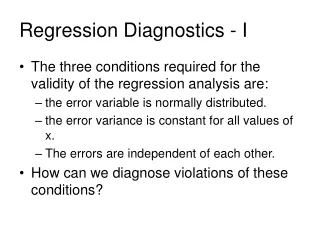
Introduction • The first section of this chapter introduces functions for diagnosing and correcting collinearity problems. • The last section discusses functions to detect and correct for outliers and influential observations in regression problems.
Collinearity diagnostics and procedures • Collinearity problem is that near linear relations among the explanatory variable vectors tends to degrade the precision of the estimated parameters.
Collinearity diagnostics and procedures • One way to illustrate the increase in dispersion of the least-squares estimates is with a Monte Carlo experiment. • generate a set of y vectors from a model where the explanatory variables are reasonably orthogonal, involving no near linear dependencies. • Alternative sets of y vectors are then generated from a model where the explanatory variables become increasingly collinear.
Collinearity diagnostics and procedures • The specific experiment involved using three explanatory variables in a model shown in :
Collinearity diagnostics and procedures • Initially, the three explanatory variables X1;X2;X3, were generated as random numbers from a uniform distribution. This ensures that they will be reasonably orthogonal or independent, not involved in any near linear dependencies. • We followed a typical Monte Carlo procedure, producing1000 different y vectors by adding a normally distributed random vector to the same three fixed X's multiplied times the parameters , whose values were set to unity.
Collinearity diagnostics and procedures • To create collinear relations we used the scheme shown in (4.2) where we no longer generate the X2 and X3 vectors independently. • Instead, we generate the X2 vector from the X3 vector with an added random error vector u.
Collinearity diagnostics and procedures • To generate data sets with an increasing amount of collinearitybetween X2 and X3, we adopted the following strategy: • First set the variance of the random normal error vector u at 1.0 and generate the X2 vector from the X3 vector. • Use the three vectors X1;X2;X3 to generate a set of 1000 Y vectors by adding the exact same vector that we used in the benchmark generation to these three fixed X's. The virtue of using the vector from the benchmark is that, we hold the noise in the data generation process constant.
Collinearity diagnostics and procedures • Two additional sets of 1000 Y vectors were generated in the same manner based on the same X3 and X1 vectors, but with two new versions of the X2 vector generated from X3. The new X2 vectors were produced by decreasing the variance of the random vector u to 0.5 and 0.1, respectively.
Collinearity diagnostics and procedures • The MATLAB code to produce this experiment is:
Collinearity diagnostics and procedures • The results of the experiment showing both the means and standard deviations from the distribution of estimates are:
Collinearity diagnostics and procedures • The means of the estimates are unaffected by the collinearity problem. • Turning attention to the standard deviations from the three collinear data sets we see a clear illustration that increasing the severity of the near linear combination between X2 and X3 produces an increase in the standard deviation of the resulting distribution for the and estimates associated with X2 and X3.
Function bkw()Belsley, Kuh, and Welsch (1980) • The diagnostic is capable of determining the number of near linear dependencies in a given data matrix X, and the diagnostic identifies which variables are involved in each linear dependency.
Function bkw() • Based on the Singular Value Decomposition that decomposes a matrix , where U contains the eigenvectors of X and D is a diagonal matrix containing eigenvalues. • 奇異值分解法
Function bkw() • The procedure for a k variable least-squares model is described in the following. The variance of the estimate can be expressed as shown in
Function bkw() • Since small are associated with near linear dependencies, an unusually large proportion of the variance of the coefficients of variables involved in the linear dependency will be concentrated in the components associated with the small .
Function bkw() It is shown in Belsley, Kuh and Welsch (1980) that a large value of the condition index, is associated with each near linear dependency, and the variates involved in the dependency are those with large proportions of their variance associated with large magnitudes.
Function bkw() • Belsley, Kuh, and Welsch (1980) determined that variance-decomposition proportions in excess of 0.5 indicate the variates involved in specific linear dependencies. The joint condition of magnitudes for
Function bkw() • An example of BKW:
Function bkw() The results of the program are shown below. They detect the near linear relationship between variables 1, 2 and 4 which we generated in the data matrix X.
Function ridge() • A common corrective procedure for this problem is ridge regression, which is implemented by the function ridge. Ridge regression attacks the problem of small eigenvalues in the matrix by augmenting or inflating the smallest values to create larger magnitudes.
Function ridge() • The scalar term is called the `ridge' parameter. The ridge regression formula is shown in : • Consider using the singular value decomposition of. This allows us to rewrite as:
Function ridge() • Since is a diagonal matrix, containing zeros on the off-diagonal elements, adding this to the V ‘DV matrices will only affect the elements of the diagonal matrix D.
Function ridge() • An expansion of the matrix
Function ridge() • To illustrate how addition of the parameter to the eigenvalues impacts the estimates, consider the following numerical example. The Monte Carlo experiment for the strongest collinear relationship (where = 0.1) produced the eigenvalues shown in
Function ridge() • As an example, consider the following MATLAB program
Function ridge() • Result:
Function ridge() • The ridge estimates increase the precision as indicated by the larger t-statistics. • A point to note about ridge regression is that it does not produce unbiased estimates. The amount of bias in the estimates is a function of how large the value of the ridge parameter is. Larger values of lead to improved precision in the estimates - at a cost of increased bias.
Function rtrace • A function rtrace helps to assess the trade-off between bias and efficiency by plotting the ridge estimates for a range of alternative values of the ridge parameter. The documentation for rtrace is:
Function rtrace • As an example of using this function
Outlier diagnostics and procedures • Outlier observations are known to adversely impact least-squares estimates because the aberrant observations generate large errors. • Function dfbetaproduces a set of diagnostics discussed in Belsley, Kuh and Welsch (1980).
Function dfbeta • The function dfbeta returns a structure that can be used to produce graphical output.
Function dfbeta • An example where we generate a data set and then artificially create two outliers at observations #50 and #70 is shown below. The graphical output from pltdfbin Figure 4.2 shows a graph of the change in associated with omitting each observation. We see evidence of the outliers at observations #50 and #70 in the plot.
Outlier diagnostics and procedures • A number of alternative estimation methods exist that attempt to downweight outliers. The regression library contains a function robust and olst as well as lad that we developed in Chapter 3. The documentation for robustis:
Function robust • An example:
Function olst • The routine olst performs regression based on an assumption that the errors are t-distributed rather than normal, which allows for “fat-tailed“ error distributions. The documentation is: T-distribution PDF
Function pair • Another graphical tool for regression diagnostics is the pairs function that produces pairwise scatterplots for a group of variables as well as histograms of the distribution of observations for each variable.