Download
1 / 35
350 likes | 352 Views
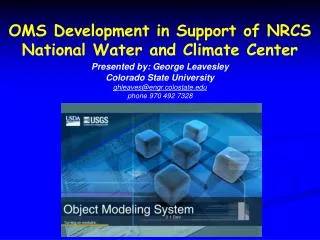
NRCS National Water and Climate Center Update Tom Pagano Tom.Pagano@por.usda.gov 503 414 3010 Natural Resources Conservation Service. Graphical Products (GIS) Daily Update Guidance Forecasts. NRCS Webpage Circa 2001 until Sept 2006(!). Design principles Rich context in

E N D
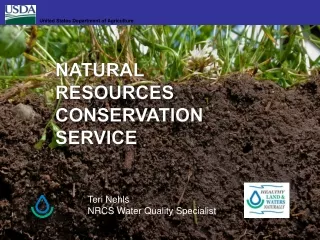
NRCS National Water and Climate Center Update Tom Pagano Tom.Pagano@por.usda.gov 503 414 3010 Natural Resources Conservation Service
Graphical Products (GIS) Daily Update Guidance Forecasts
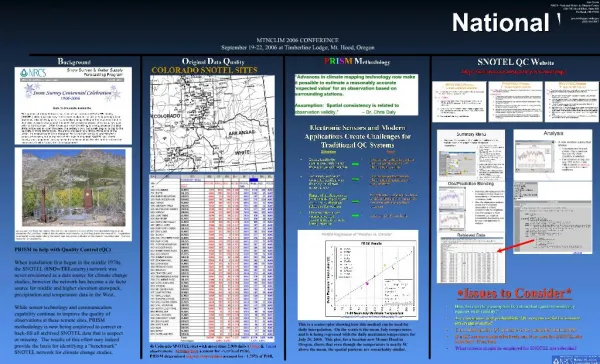
Design principles Rich context in neutral colors Data emphasized without being ham-fisted Still usable in black and white Completely annotated NRCS Webpage 2007
Combined NRCS/NWS plots (using ACIS data)
Where to get maps: http://www.wcc.nrcs.usda.gov/gis To get actual data files
Daily Forecast Updates Currently, forecasts produced 1x per month using monthly data. With a simulation model (e.g. ESP) can be run more frequently but is resource intensive.
Daily Forecast Updates Daily SNOTEL data exists for 20+ years. Statistical forecast techniques are cheap/easy. Why not develop 365 forecast equations/year?
Daily Forecast Updates Daily SNOTEL data exists for 20+ years. Statistical forecast techniques are cheap/easy. Why not develop 365 forecast equations/year? Developed Excel application to calibrate daily forecasts (1.5 mins) and run them on a scheduler (10 sec)
Three big problems in water supply forecasting: • Intercorrelated predictors • Varying periods of record • Missing realtime data
Three big problems in water supply forecasting: • Intercorrelated predictors • Varying periods of record • Missing realtime data Z-Score Regression (Pagano 2004) Relative contribution of predictors Prevents compensating regression coefficients. Aggregates like predictors, emphasizing best ones. Does not require serial completeness. Pagano, T. C. 2004: My dissertation. University of Arizona, Tucson, Department of hydrology and water resources
Period of record range (10,30,70,90 percentile) 1971-2000 avg Period of record median
Period of record range (10,30,70,90 percentile) 1971-2000 avg Period of record median Official coordinated outlooks
Daily Update Forecasts Period of record range (10,30,70,90 percentile) 1971-2000 avg Period of record median Official coordinated outlooks
Expected skill Daily forecast 50% exceedence Official forecasts
Calibration dataset of today’s equation Current forecast
Sept 30 May 1
6% avg error Courtesy Randal Wortman Army Corps
http://www.wcc.nrcs.usda.gov/ wsf/daily_forecasts.html If you want more forecasts in your area: Contact your NRCS Snow Survey Data Collection Officers and/or Water Supply Specialists