Download
1 / 58
590 likes | 763 Views
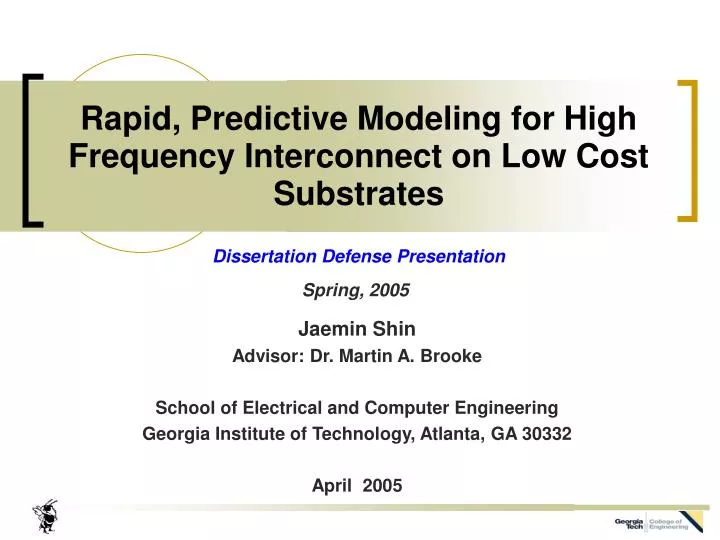
Rapid, Predictive Modeling for High Frequency Interconnect on Low Cost Substrates. Dissertation Defense Presentation Spring, 2005. Jaemin Shin Advisor: Dr. Martin A. Brooke School of Electrical and Computer Engineering Georgia Institute of Technology, Atlanta, GA 30332 April 2005.

E N D
Rapid, Predictive Modeling for High Frequency Interconnect on Low Cost Substrates Dissertation Defense Presentation Spring, 2005 Jaemin Shin Advisor: Dr. Martin A. Brooke School of Electrical and Computer Engineering Georgia Institute of Technology, Atlanta, GA 30332 April 2005
Outline • Objective • Limitations of Electrical Board-level Interconnects • Background • Motivation • Proposed Modeling Procedure • Modeling of Straight Microstrip Lines • Modeling of Serpentine Interconnects • Conclusions
Objective • Our goal is to develop arapid, predictive (scalable) measurement-based modeling method for high frequency interconnects on low cost substrates: • Modeling of interconnect structures • Prediction by scalability and interpolation • Evaluation of modeling performance with measured behaviors and a simulation tool.
Outline • Objective • Limitations of Electrical Board-level Interconnects • Board-level Interconnect • Geometrical limitations at high frequency • Background • Motivation • Proposed Modeling Procedure • Modeling of Straight Microstrip Lines • Modeling of Serpentine Interconnects • Conclusions
Board-level Interconnect in Telecommunication Backplane Interconnect Chip-to-chip Interconnect [1] http://www.ece.gatech.edu/research/labs/mag/mixed_signal/mixedsig3.htm
Limitations of Electrical Board-level Interconnects 1 • Signal integrity problems • Transmission-line effects • High rising and falling time and delay time • High channel loss of long channels • Non-ideal effects at high frequency • Skin effect • Frequency-dependent dielectric loss • Manufacturing variations • Geometrical issues • Geometrical discontinuity • Reflection loss (Echo effect) • Dense connections • Self-coupling • Crosstalk • Electromagnetic interference (EMI)
Limitations of Electrical Board-level Interconnects 2 • Switching noise • High power consumption • Thermal problem Approaches to addressing the limitations • Advanced electrical technology • High speed interconnect driver : LVDS, CML, and PECL • Clock & data recovering circuit (CDR) • High performance board material • Co-design with accurate channel model • Optical interconnect technology • Optical technology • VSCEL (Vertical Surface Cavity Emitting Laser), micro-mirror, and optical waveguide embedding techniques Contribution of this thesis work
Trend of Board-level Interconnect • According to 2003 ITRS (International Technology Roadmap of Semiconductor) • In near-term years, off-chip frequency will be to keep its speed lower than 10 GHz. • Most telecommunication companies have preferred the use of low cost FR4 materials. • Moreover, cost-performance and low-cost products occupy a considerable area of the market • Thus, interconnects on FR4 are still attractive. • However, at high frequency, FR4 material needs more design work with an efficient, accurate model to achieve acceptable electrical performance. [2] http://public.itrs.net/Files/2003ITRS/Home2003.htm
Example 1: Long Straight Lines of Different Dielectric Materials 1 • Four different board materials • Configuration of striplines with 50-Ω characteristic impedance • 12-mil wide, 18-inch long channel line [3] http://www.tycoelectronics.com/products/simulation/files/papers/dc00brdh.pdf
Example 1: Long Straight Lines of Different Dielectric Materials 2 • Eye diagrams at 5 Gbps and 10 Gbps a) 5 Gbps b) 10 Gbps [3] http://www.tycoelectronics.com/products/simulation/files/papers/dc00brdh.pdf
130 mil 1.7 mil 20 mil εr=4.3 FR4 Example 2: Long Straight Lines with a Via • Low-cost FR4 material • Microstrip with 50-Ω characteristic impedance • Via connection • Three different line lengths (1, 10 and 20cm) and three different speeds (1 G, 2.5 G and10 Gbps) Straight transmission line without via Straight transmission line with via
130-mil wide M-shaped serpentine structure with 65-mil spacing 130-mil wide 7-turn serpentine structure with 130-mil spacing Example 3: Interconnect Structures with Couplings and Bends • 130-mil wide serpentine structures on FR4 board • Coupling effects and bending effects 130-mil wide M-shaped serpentine structure with 130-mil spacing Bending effect & Line length Coupling effect 10Gbps
Outline • Objective • Limitations of Electrical Board-level Interconnects • Background • Non-ideal Effects • Previous Modeling Methods • Motivation • Proposed Modeling Procedure • Modeling of Straight Microstrip Lines • Modeling of Serpentine Interconnects • Conclusions
Non-ideal Effects on Transmission Line 1 Skin depth • Skin effect =130mil
Non-ideal Effects on Transmission Line 2 • Frequency-dependent dielectric loss • Complex dielectric constant due to the electric polarization • Loss tangent FR4 BT/Epoxy Polymide 951 Green TapeTM [4] D. I. Amey and S. J. Horowitz, "Materials performance at frequencies up to 20 GHz," presented at IEMT/IMC Symposium, 1997., 1st [Joint International Electronic Manufacturing Symposium and the International Microelectronics Conference], 1997.
Non-ideal Effects on Transmission Line 3 • Manufacturing variations • Composite ratio (glass- to- resin ratio) • Conductor surface roughness • Too rough and random • Fabrication tolerance • The need for statistical approaches Metal FR4 SEM (Scanning Electron Microscope) picture
Previous Modeling Methods • Earlier interconnect research: microwave and digital engineering • Microwave engineering: transmission lines in narrow bandwidths • Digital engineering: timing analysis at low frequency • High-frequency digital interconnect: frequency analysis based on the electromagnetic equations, numerical methods, and measurement techniques • Three classical methods • Analytical equation-based method • Numerical full-wave-based method • Measurement-based method
Analytical Equation-based Method • Direct derivation of a model from the fundamental electromagnetic equations • Neither accurate nor practical unless the structures of interest are simple • Not flexible • Difficult to develop, in general • Basic insight and background for the two following methods
Numerical Full-wave-based Method • Maxwell equation-based method • Discretization of a structure into small segments to obtain accurate responses of the entire system (trade-off between accuracy and computational efficiency) • Accurate and highly flexible • Slow speed and extensive memory requirements for complex geometrical systems • Difficult to incorporate the non-ideal effects such as frequency-dependent variables and manufacturing variations
Measurement-based Method • Measured data in the frequency domain can be used to find circuit model parameters. Optimization techniques are used for the equivalent-circuit parameters • Statistical modeling approaches can be applied to overcome the manufacturing variations • The non-ideal effects are naturally incorporated • Compatible with the existing circuit simulators • Very accurate and fast • Needs to be more flexible
Motivation • The need for an accurate, rapid model for interconnects on FR4 to address electrical board-level interconnect limitations at high frequency • FR4 material limitations • Non-ideal effects • Geometrical limitations • Inefficiency of numerical methods for complex structures • Advantages of the measurement-based method compared with others • Easy: Compatibility with the circuit simulators • Efficient - Very fast simulation speed - No need for heavy computation resources • Accurate: Incorporation of the non-ideal effects • Statistical: Incorporation of the fabrication tolerance • The need for improved flexibility: the use of scalability and interpolation can achieve this goal. Co-simulation and Co-design with circuits
Determining the interconnect structures to be considered Defining building blocks Statistical approaches Extraction of EC-parameters using optimization Proposed Modeling Procedure Co-simulation and co-design with circuitry Generating model library Design and fabrication Verification with measured data Calibration and measurement Predicting other structures by using the scalable model and interpolation Generalization Extension Initial modeling
Performance Evaluation • Modeling performance attributes • Accuracy • Frequency domain: Impedance parameters • Time domain: Eye diagrams • Efficiency • Computation resources • Simulation times • Utility • Limited to accessibility
Measurement Setup • Time response • Interconnect verification • Eye diagrams • Pattern generator and digital oscilloscope • Frequency response • Channel characterization • Z-parameters converted from measured S-parameters • SOLT (Short-open-load-thru) calibration using 3.5 mm calibration kit • Vector network analyzer (VNA) VNA Port 1 Port 2 Digital Oscilloscope Pattern generator Device Under Test (DUT) DUT
Momentum Measured Momentum Simulation 2400 mils Momentum simulation Layout Z21 Magnitude (dB) Z11 Magnitude (dB) Z21 Phase (degree) Z11 Phase (degree) Momentum simulation results of the 2400 mil microstrip with SMA connector
Outline • Objective • Limitations of Electrical Board-level Interconnects • Background • Motivation • Modeling Procedure • Modeling of Straight Microstrip Lines • Modeling Description • Results and Performance Comparison • Modeling of Serpentine Interconnects • Conclusions
50 mil SMA Building Block SMA Building Block Rectangular Building Block Rectangular Building Block SMA Connector Building Block Building Block Diagrams and Equivalent Circuits • 800-mil long line • 400-mil long line
Test Structures of the Straight Microstrip Lines 1600 mil long line 2400 mil long line 400 mil long line (Predictive model) 1200 mil long line 800 mil long line
Optimization of Equivalent-circuit Parameters Equivalent-circuit block SMA connector building block S-parameter simulation setup 50 mil long microstrip building block Measured s-parameter data block Optimization setup Initial values
Measured Modeled Optimized Z-parameter Data of the 400-mil Long Line Z11 Magnitude (dB) Z21 Magnitude (dB) Z21 Phase (degree) Z11 Phase (degree)
Momentum Measured Modeled Predicted Z-parameter Data of the 800-mil Long Line Z11 Magnitude (dB) Z21 Magnitude (dB) Z21 Phase (degree) Z11 Phase (degree)
Momentum Measured Modeled Predicted Z-parameter Data of the 2400-mil Long Line Z11 Magnitude (dB) Z21 Magnitude (dB) Z21 Phase (degree) Z11 Phase (degree)
Comparison of Eye Diagrams of the 2400-mil Long Line • Measured eye diagrams 2.5 Gbps 7.5 Gbps 10 Gbps 5 Gbps 1 Gbps 500 mV 0 V • Simulated eye diagrams using the predicted structure 500 mV 0 V
Simulation Time vs. Line Length • Simulation Resources • a UNIX computer • 500 MHz Ultra SPARC IIi CPU • 2 G-byte memory
Outline • Objective • Limitations of Electrical board-level Interconnects • Background • Motivation • Modeling Procedure • Modeling of Straight Microstrip Lines • Modeling of Serpentine Interconnects • Modeling Description • Results and Performance Comparison • Interpolation • Conclusions
Building-block Diagrams and Equivalent Circuits • M-shaped structure • N-shaped structure SMA Connector Building Block Coupled Rectangular Building Block U-shaped Building Block Uncoupled Rectangular Building Block
Combination of Equivalent Circuits • Equivalent circuits of the N-shaped structure
Test Structures 1 • 3 different widths and 3 different spacings Predicting
Test Structures 2 • Four additional extended structures • 130-mil width and 130-mil spacing (1S) • 4-, 5-, 6- and 7- turn serpentine interconnect structures 7 turns 6 turns 4 turns 5 turns
Initial values U-shape SMA connector Uncoupled Rectangle Uncoupled Rectangle Coupled Rectangle Mutual Coupling Element Optimization of Equivalent-circuit Parameters Predictive equivalent circuit block Measured s-parameter data block S-parameter simulation setup Optimization setup
Measured Modeled Optimized Z-parameter Data of the N-shaped Serpentine Structure Z11 Magnitude (dB) Z21 Magnitude (dB) Z21 Phase (degree) Z11 Phase (degree)
Momentum Measured Modeled Predicted Z-parameter Data of the M-shaped Serpentine Structure Z11 Magnitude (dB) Z21 Magnitude (dB) Z21 Phase (degree) Z11 Phase (degree)
Comparison of Eye Diagrams of the M-shaped Serpentine Structure • Measured eye diagrams 2.5 Gbps 7.5 Gbps 10 Gbps 5 Gbps 1 Gbps 500 mV 0 V • Simulated eye diagrams using the predicted structure 500 mV 0 V
Momentum Measured Modeled Predicted Z-parameter Data of the 7-turn Serpentine Structure Z11 Magnitude (dB) Z21 Magnitude (dB) Z21 Phase (degree) Z11 Phase (degree)
Comparison of Eye Diagrams of the 7-turn Serpentine Structure • Measured eye diagrams 2.5 Gbps 7.5 Gbps 10 Gbps 5 Gbps 1 Gbps 500 mV 0 V • Simulated eye diagrams using the predicted structure 500 mV 0 V
Simulation Time vs. Number of Turns • Simulation Resources • a UNIX computer • 500 MHz Ultra SPARC IIi CPU • 2 G-byte memory N-shaped M-shaped
Interpolation • N-shaped Structure Interpolation 65-mil spacing (0.5 S) Spacing-interpolation 130-mil width and 130-mil spacing (1S) 156-mil width (+20%) 104-mil width (-20%) Width-interpolation 260-mil spacing (2 S)
Measured Modeled Z-parameter Data of N-shaped Structure Predicted by Width-interpolation • Predicted Z-parameter data of the 130-mil wide N-shaped serpentine structure Z11 Magnitude (dB) Z21 Magnitude (dB) Z11 Phase (degree) Z21 Phase (degree)
Comparison of Eye Diagrams of the Predicted N-shaped Structure by Width-interpolation • Measured eye diagrams 2.5 Gbps 7.5 Gbps 10 Gbps 5 Gbps 1 Gbps 500 mV 0 V • Simulated eye diagrams using the predicted structure obtained by width-interpolation 500 mV 0 V
Measured Modeled Z-parameter Data of M-shaped Structure Predicted by Width-interpolation • Z-parameter data of the 130-mil wide M-shapedserpentine structure predicted using EC-parameters of the width-interpolated N-shaped structure Z11 Magnitude (dB) Z21 Magnitude (dB) Z21 Phase (degree) Z11 Phase (degree)