Download
1 / 22
220 likes | 311 Views
COURSE PRESENTATION:. Discriminative Frequent Pattern Analysis for Effective Classification. Presenter: Han Liang. Outline. Motivation Introduction Academic Background Methodologies Experimental Study Contributions. Motivation.

E N D
COURSE PRESENTATION: Discriminative Frequent Pattern Analysis for Effective Classification Presenter: Han Liang
Outline • Motivation • Introduction • Academic Background • Methodologies • Experimental Study • Contributions
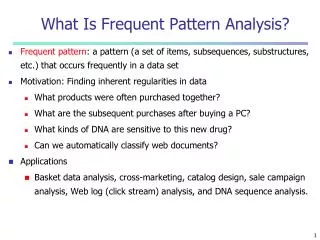
Motivation • Frequent patterns are potentially useful in many classification tasks, such as association rule-based classification, text mining, and protein structure prediction. • Frequent patterns can accurately reflect underlying semantics among items (attribute-value pairs).
Introduction • This paper investigates the connections between the support of a pattern and its information gain (a discriminative measure), and develops a method to set the minimum support in pattern mining. It also proposes a pattern selection algorithm. Finally, the generated frequent patterns can be used for building high quality classifiers. • Experiments on UCI data sets indicate that the frequent pattern-based classification framework can achieve high classification accuracy and good scalability.
Classification – A Two-Step Process Step1: Classifier Construction: learning the underlying class probability distributions. > The set of instances used for building classifiers is called training data set. > The learned classifier can be represented as classification rules, decision trees, or mathematical formulae (e.g. Bayesian rules). Step2: Classifier Usage: classifying unlabeled instances. > Estimate accuracy of the classifier. > Accuracy rate is the percentage of test instances which are correctly classified by the classifier. > If the accuracy is acceptable, use the classifier to classify instances whose class labels are not known.
Classification Process I – Classifier Construction Classification Algorithms Training Data Learned Classifier IF rank = ‘Professor’ OR years > 6 THEN tenured = ‘Yes’
Classification Process II – Use the Classifier in Prediction Learned Classifier Test Data IF rank = ‘Professor’ OR years > 6 THEN tenured = ‘Yes’ Unseen Data (Jeff, Professor, 4) Yes Tenured?
Association-Rule based Classification (ARC) Classification Rule Mining: discovering a small set of classification rules that forms an accurate classifier. > The data set E is represented by a set of items (or attribute-value pairs) I = {a1,…an} and a set of class memberships C = {c1,..cm}. > Classification Rule: X => Y, where X is the body and Y is the head. > X is a set of items (a sub set of I, denoted as X I). > Y is a class membership item. > Confidence of a classification rule: conf = S(X Y) /S(X). > Support S(X): the number of training instances that satisfy X.
ARC-II: Mining - Apriori Generate all the classification rules with support and confidence larger than predefined values. > Divide training data set into several subsets; one subset for each class membership. > For each subset, with the help of on-the-shelf rule mining algorithms (e.g. Apriori), mines all item sets above the minimum support, and call them frequent item sets. > Output rules by dividing frequent item sets in rule body (attribute-value pairs) and head (one class label). > Check if the confidence of a rule is above the minimum confidence. > Merge rules from each sub set, and sort rules according to their confidences. mining pruning classification
ARC-III: Rule Pruning Prune the classification rules with the goal of improving accuracy. > Simple Strategy: > Bound the number of rules. > Pessimistic error-rate based pruning. > For a rule, if we remove a single item from the rule body and the new rule decreases in error rate, we will prune this rule. > Data set coverage approach. > If a rule can classify at least one instance correctly, we will put it into the resulting classifier. > Delete all covered instances from training data set. mining pruning classification
ARC-IV: Classification Use the resulting classification rules to classify unseen instances. > Input: > Pruned, sorted list of classification rules . > Two different approaches: > Majority vote > Use the first rule that is applicable to the unseen instance for classification. mining pruning classification
The Framework of Frequent-Pattern based Classification (FPC) • Discriminative Power vs. Information Gain • Pattern Generation • Pattern Selection • Classifier Construction
Discriminative Power vs. Information Gain - I The discriminative power of a pattern is evaluated by its information gain. • Pattern based Information Gain: > Data set S has Sitraining instances that belong to class Ci. Thus, S is divided into several subsets, denoted as S = {S1…Si…Sm}. > Pattern Xdivides S into two subsets: the group where pattern X is applicable and the group where pattern X is rejected. (binary splitting) > The information gain of pattern X is calculated via: where I(S1,S2,…Sm) is represented by: and E(X) is computed by:
Discriminative Power vs. Information Gain - II The discriminative power of a pattern is evaluated by its information gain. • Information Gain is related to pattern support and pattern confidence: > To simplify the analysis, assume pattern X {0,1} and C= {0,1}. Let P(x=1) = , P(c=1) = p and P(x=1|c=1) =q. > Then, can be instantiated as: where and q are actually the support and confidence of pattern X.
Discriminative Power vs. Information Gain - III The discriminative power of a pattern is evaluated by its information gain. • Information Gain is related to pattern support and pattern confidence: > Given a dataset with a fixed class probability distribution, I(S1,S2,…Sm) is a constant part. > E(X) is a concave function, it reaches its lower bound w.r.t. q, for fixed p and . > After mathematical analysis, we draw the following two conclusions that: > The discriminative power of a low-support pattern is poor. It will harm classification accuracy due to over-fitting. > The discriminative power of a very high-support pattern is also weak. It is useless for improving classification accuracy. > Experiments on UCI datasets. The X axis represents the support of a pattern and the Y axis represents the information gain. We can clearly see that both low-support and very high-support patterns have small values of information gain. Austral Sonar
Pattern Selection Algorithm MMRFS • Relevance: A relevance measure S is a function mapping a pattern X to a real value such that S(X) is the relevance w.r.t. the class label. > Information gain can be used as a relevance measure. > A pattern can be selected if it is relevant to the class label measured by IG. • Redundancy: A redundancy measure R is a function mapping two patterns X and Z to a real value such that R (X, Z) is the redundancy value between them. > Mapping function: > A pattern can be chosen if it contains very low redundancy to the patterns already selected.
Pattern Selection Algorithm MMRFS-II • The MMRFS algorithm searches over the pattern space in a greedy way. • In the beginning, a pattern with highest relevance value (information gain value) is selected. Then the algorithm incrementally selects more patterns from F. • A pattern is selected if it has the maximum estimated gain among the remaining patterns F-Fs. The estimated gain is calculated by: • The coverage parameter is set to ensure that each training instance is covered at least times by the selected patterns. In this way, the number of patterns selected is automatically determined.
Experimental Study • Basic learning classifiers – used to classify unseen instances. > C4.5 and SVM • For each dataset, a set of frequent patterns F is generated. > A basic classifier will be built using all patterns in F. We call it Pat_All. > MMRFS is applied on F and a basic classifier is built using a set of selected features Fs. We call the resulting classifier Pat_FS. > For comparisons, basic classifiers which are built on single features are also tested. Item_All represents the basic classifier which is built on all single features, and Item_FS built on a set of selected single ones. • Classification Accuracy. • All experimental results are obtained by use of ten-fold cross validation.
Experimental Study-II • Table 1 shows the results by SVM. • Pat_FS has significant improvement over Item_All and Item_FS. This conclusion indicates that: • > the discriminative power of some frequent patterns is • higher than that of single features. • The performance of Pat_All is much worse than that of Pat_FS. That confirms that redundant and non-discriminative patterns let classifiers over-fit the data and decrease the classification accuracy. • The experimental results by C4.5 is similar to SVM’s.
Experimental Study-III: Scalability Test • Scalability tests are performed to show the frequent pattern-based framework is very scalable with good classification accuracy. • Three large UCI data sets are chosen. • In each table, experiments are conducted by varying min_sup. #Patterns gives the number of frequent patterns. Time gives the sum of pattern mining and pattern selection time. • min_sup =1is used to enumerate all feature combinations. Pattern selection fails with such a large number of patterns. • In contrast, the frequent pattern-based framework is very efficient and achieves good accuracy within a wide range of minimum support thresholds.
Contributions • This paper propose a framework of frequent pattern-based classification. By analyzing the relations between pattern support and its discriminative power, the paper shows that frequent patterns are very useful for classification. • Frequent pattern-based classification can use the state-of-the-art frequent pattern mining algorithm for pattern generation, thus achieving good scalability. • An effective and efficient pattern selection algorithm is proposed to select a set of frequent and discriminative patterns for classification.
Thanks! Any Question?