Download
1 / 30
310 likes | 590 Views
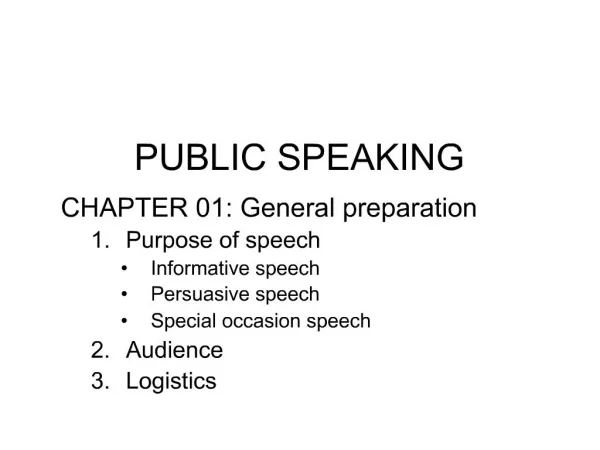
PUBLIC SPEAKING. Using Visual Aids. Advantages of Visual Aids. Clarity Interest Retention Credibility Persuasiveness Speaking comfort. Types of Visual Aids. Objects Models Photos Drawings Graphs. Charts Transparencies Video Multimedia presentations Speaker. Objects.

E N D
PUBLIC SPEAKING Using Visual Aids
Advantages of Visual Aids • Clarity • Interest • Retention • Credibility • Persuasiveness • Speaking comfort
Types of Visual Aids • Objects • Models • Photos • Drawings • Graphs • Charts • Transparencies • Video • Multimedia presentations • Speaker
Objects • Items that are available • Can be too small/large
Models • Represent other objects in detail • Small scale • Large scale • Actual size
Photographs • Enlarge to be seen clearly • Convert to transparencies for projection • Show with multimedia program
Drawings • Alternatives to photos • Must be large enough • Convert to transparencies for projection • Show with multimedia program
Graphs and Charts • Show statistical trends & patterns • Line graphs • Pie graph • Bar graph • charts
Line Graph Uses one or more lines to show changes in statistics over time or space
Pie Graph Highlights segments of circle to show distribution patterns
Bar Graph Uses vertical or horizontal bars to show comparisons among items
Charts • Summarizes large block of information, usually in list form • Help listeners visualize information • Show steps of process • Keep simple & clear
Transparencies • Images shown on an overhead projector • Prepare in advance • Make large enough • Check projector ahead of time • Useful for live drawing
Video • Clips that can be compelling or distracting • Use only when essential • Keep short • Integrate into speech • Avoid low-resolution
Multimedia Presentations • Combines several kinds of audio-visual materials • Most commonly a PowerPoint presentation • Can include music, video, etc.
Speaker • Use body to demonstrate procedure • Practice to coordinate words & actions • Using a proxy can be useful
Preparing Visual Aids • Prepare in advance • Keep simple • Make large enough • Use easy-to-read fonts • Use limited number of fonts • Use color effectively
Presenting Visual Aids • Impact depends on presentation as well as preparation • Avoid using chalkboard • Display where listeners can see • Display only while discussing
Presenting Visual Aids • Avoid passing visual aids during speech • Talk to audience, not to visual aid • Explain clearly, concisely • Practice with visual aids