Download
1 / 14
150 likes | 385 Views
PEP 201 Lab -- Pendulum. PEP 201 Lab Pendulum. Department of Physics Stevens Institute of Technology. PEP 201 Lab -- Pendulum. Equation of Motion:. a. The hole. When is small, we have:. The equation reduce to:. H bob. L rod.

E N D
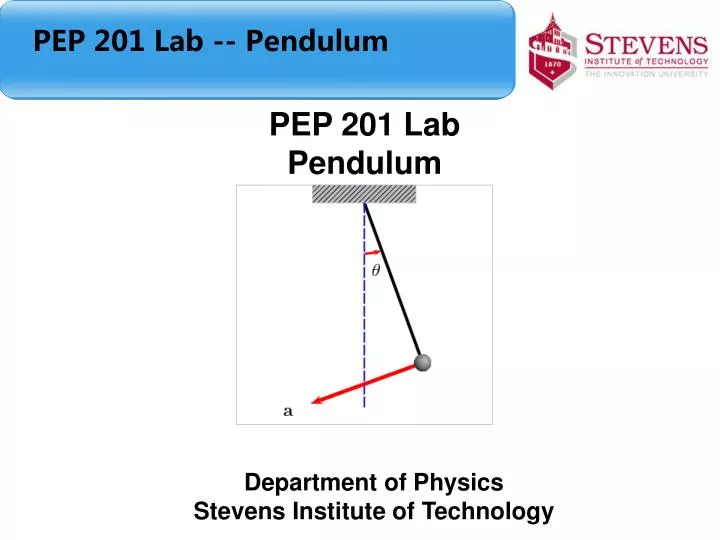
PEP 201 Lab -- Pendulum PEP 201 Lab Pendulum Department of Physics Stevens Institute of Technology
PEP 201 Lab -- Pendulum Equation of Motion: a The hole When is small, we have: The equation reduce to: Hbob Lrod This is the second order differential equation, solving this equation, we obtain Measure Mrod Mbob where
PEP 201 Lab -- Pendulum 1. Calculate the theoretical period In order to calculate the theoretical value of the period, we need to measure the following five values: Mrod, Mbob, Lrod, Hbob, a Then, subsititute all of those value to the equation. where We can use Excel file to calculate this value directly. See Excel file attached.
PEP 201 Lab -- Pendulum A. Measure the period in the experiment 1. Measure five valuesMrod, Mbob, Lrod, Hbob, a 2. Install all the equipment as the “sample” shown to you. 3. Turn the power, Open the “Data Studio”. Add a Rotary motion sensor, set: sample rate=500Hz, divisions=1440, measure the angular position, open a “graph” to observe the figure. 4. Use the “smart tool” to measure the time interval and record the results both on the blue book and on your laptop. 5. You may calculate the AVERAGE and the STDEV yourself or just use the EXCEL file to get it directly. 6. Compare the experiment result to the theoretical value. Section A is finished; the following things must be recorded: original data and one graph of the oscillating pendulum.
PEP 201 Lab -- Pendulum B. Measure the damping constant 1. Set the RMS correctly. Sample rate=500, division=1440 measure the angular position. Then place a damping device on the top of the RMS. 2. Open a graph, observe the damping process. 3. Measure each peak value and the time point of this peak (using smart tool) to calculate the damping constant. The data must be recorded both on the blue book and on your laptop. 4. Calculate the damping constant. You can design a program yourself or just input the data into the sample EXCEL file to get it directly. 5. Let the damping device a little near to the disk repeat the process above. Section B is finished. Original data and two graphs of the damping process are needed.
PEP 201 Lab -- Pendulum Equation For details of the derivation, see the menu
PEP 201 Lab -- Pendulum C. Observe the phenomenon of chaos In this section, the only thing you need to do is just observe and write down what you have observed in you experiment report. (The graph will be send to you by TA) Chaos theory is a field of study in mathematics, with applications in several disciplines including physics, engineering, economics, biology, and philosophy. Chaos theory studies the behavior of dynamical systems that are highly sensitive to initial conditions, an effect which is popularly referred to as the butterfly effect.
PEP 201 Lab -- Pendulum Week 2: Observe the coupled pendulums 1. Set two RMS correctly. Set sample rate=100Hz, division=1440, measure the angular velocity. 2. Displace one pendulum and make the other one still stand, observe the graph. 3. Displace both two pendulums to the same altitude, observe the graph. 4. Change the position of one bob on the rod to change its period, then displace one pendulum and leave the other one still stand. Observe the graph. 5. Save all the graphs you observed. (Do not forget!!!) All the graphs (3 in total) must be saved.
2. Complete the experiment report There will be a sample report. However it is just a sample, you can write your report in your own style. In general, except the introduction and conclusion, the experiment report should include: • the theoretical study of the period of the pendulum. • the data and graph in the experiment “measure the period”. • the data and graph in the experiment “measure the damping constant”. • the data and graph in the experiment “coupled pendulum”. • the graph of “chaos”. You can also write something in each experiment, such as “what you have learned from the experiment”, “analyze some problems occurred in the experiment”… Original data should be included. Finally, there are some questions for you to answer: (optional) • 1. Why the rotational inertia of the bob about its mass center can be neglected during the calculation? Hint: 2. Discuss the energy transfer between the two coupled pendulums in the experiment. (Based on the graphs you got from the experiment)