Download

1 / 10
110 likes | 327 Views
Pendulum Lab. Physics First Graphing Practice. Graphing in Physics. Physics looks for RELATIONSHIPS between variables Relationship between your independent and dependent variable No more connect the dots! (unless asked). Still linear relationship !. Graphing in Physics.

E N D
Pendulum Lab Physics First Graphing Practice
Graphing in Physics • Physics looks for RELATIONSHIPS between variables • Relationship between your independent and dependent variable • No more connect the dots! (unless asked) Still linear relationship!
Graphing in Physics • 5 shapes of graphs in this class None Direct (linear) Inverse Exponential/Square Parabolic
Pendulum Lab • 3 masses for bobs • String • Ruler • Stop watches • Balances for mass measurement • Lab partner With your lab partner, obtain the materials and make a pendulum. Make observations.
White Boarding If you put it in water, it will dramatically slow down • What observations do you see about the pendulum? • What are some factors that might have an impact on the behavior of the pendula? • Which of these behaviors or factors are related? Speed decreases as it moves The more weight, the more momentum Lighter weights swing faster The heavier the weight, the less time it spends in motion Requires an outside force to push it If you continue to hit it, it will keep going Sturdiness of fixed object Length of the string gravity Aerodynamics (shape) of the bob Amplitude/angle of drop Length of your fixed object force Mass of the bob Material your string is made out of Length of String Mass of Bob Amplitude
On your white board…… • What are your dependent variables? • The period of the swing (T) – amount of swings in a specific time period. • Which axis will this be graphed on? • The vertical axis ((y) axis). • What are your independent variables? • Length (l), mass (m), amplitude (A) • Which axis will this be graphed on? • The horizontal axis ((x) axis).
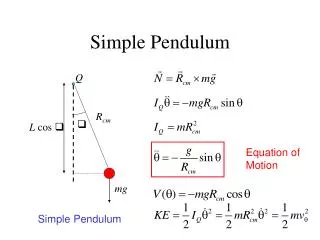
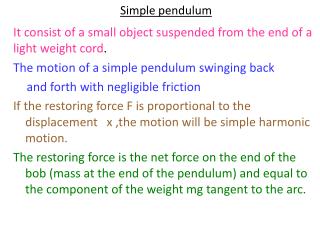
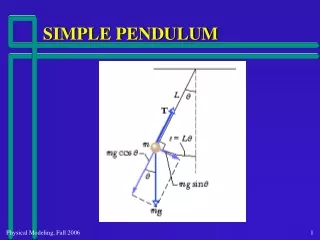
Period - The time required for one complete one crest to the next crest - measured in seconds. Amplitude is the string's angular displacement from its vertical or its equilibrium position. Length of the pendulum is measured from the pendulum's point of suspension to the center of mass of its bob.
With your lab partner….. • Your lab group is going to create an experiment to test what affects a pendulum. • 3 different variables you will manipulate to test the effects of a pendulum. • Length of String • Mass of Bob • Amplitude of drop • For each variable you are testing, you need 3 different experiments • EX: if testing mass: • weight #1 (3 trials) • weight #2 (3 trials) • weight #3 (3 trials) • For each variable you are testing, you need 3 trials.
With your lab partner….. • Create your own data chart • Record all units in SI units • Grams, seconds, meters….. ect. • Create your own graph using graph paper • EVERYONE does their own graph • Identify the following steps of the Scientific Method: • What is your question? (what is the relationship between your variables?) • What is your dependent variable? • What is your independent variable? • What are your constant variables? • What is your hypothesis?
Analysis/Discussion • GRAB A WHITEBOARD with your partner. • Answer the following on your whiteboard: • What were your variables? • What was your hypothesis? • What were your controls? • What conclusion did you reach about the type of relationship your variables have? • Draw a rough sketch of your graph • Label your axes with units and title your graph! • What/How would change to modify your experiment?