Download
1 / 41
420 likes | 577 Views
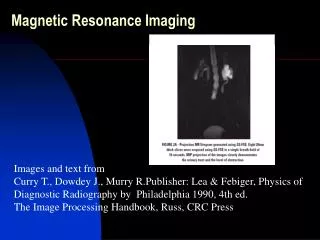
Magnetic Resonance Imaging Part 1 The Science Bit. Lynn Graham DCR Msc Clinical Specialist in MRI. Particle Physics!. OUTLINE ( part 1). History + Local origins of MRI Fundamental Physics of MRI Tissue contrast + Versatility. History Lesson. Carl Fredrich Gauss. (1777-1855)

E N D
Magnetic Resonance ImagingPart 1The Science Bit Lynn Graham DCR Msc Clinical Specialist in MRI
OUTLINE ( part 1) • History + Local origins of MRI • Fundamental Physics of MRI • Tissue contrast + Versatility
History Lesson • Carl Fredrich Gauss. (1777-1855) • German Physicist • Findings led to a knowlegdge of magnetism and its quantifiation • Gauss- unit of measurement of magnetism • Nikola Tesla (1856 –1943) • Serbian Electrical Engineer • Work in electromagnetic induction • Tesla –unit of measurement for Magnetic Field strength
Born 11th July 1857 at Magheragall, Co Antrim Educated at RBAI, Belfast Graduated from Queens 1877 Appointed Professor @ St Johns College Cambridge 1903 Knighted 1909 Sir Joseph Larmor FRS.MA.DSCMathematician + Physicist 1857-1942
The Larmor Equation Key to Nuclear Magnetic Resonance Clinical Magnetic Resonance Imaging
NuclearMagnetic Resonance NUCLEAR ATOMIC SPIN : • +ve electric charge • Intrinsic spin/ Precession • nuclear magnetic moment
+ Nuclear Magnetic Resonance • MAGNETIC MOMENTS ALIGN WITH B0 No B0: random motion B0 : alignment
Nuclear Magnetic Resonance Out of phase In phase
The Larmor Equation • L = Larmor frequency (MHz) • B0 = magnetic field (Tesla) • = gyromagnetic ratio Key to Nuclear Magnetic Resonance
H H H H H H H H H H O C C C C Water Fatty acid chain NMR – CLINICAL MRI Fat + Water = 99% body tissue H+: ALIGNMENT + PRESCESSION
Apply the Larmor equation NMR – CLINICAL MRI H1 @ 1 T : = 42.58 MHz T-1 @ 1.5 T Larmor frequency = 63.87 MHz
Electromagnetic Spectrum Precessional Frequency of H+
Resonance + Excitation • Energy in the form of an RF pulse • Leads to misalignment with B0: antiparallel • Also leads to phase coherence. This is Excitation
Resonance / Excitation B0 RF pulse
Relaxation • Remove the RF and the spins will loose their energy. • Realign with B0 : “relax” • Loose phase coherance : “decay” Energy loss is variable
+ Excitation + Relaxation = MR Signal Bo NMV 90 RF pulse Current induced in RF coil due to alternating B field = MRI signal
Image Formation X Z Y
Spatial Localisation B0 + B0 Gradient B0 -
Phase Slice Frequency Image Formation XX Y Z
Pixel Mapping Each line of data is stored as the Image is built up gradually Fourier transform decodes data + forms the image Phase Frequency
X Z Y
Resolution Few pixels Short scan time Many pixels Long scan time
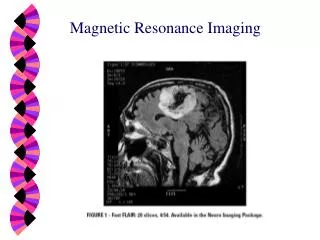
T1 Fluid dark T2 Fluid bright Differing MR Images
Relaxation : Free Induction Decay (FID) • The spins will loose their energy in two ways: Energy decays slowly Relaxing back to B0 T1 Recovery T2 decay Loose phase coherance
T1 Recovery B0 Realign with
T2 Decay In phase Out of phase Loose phase
Brownian Motion • WATER : • Small , fast molecules • Fewer bumps • Slow energy loss • Long T1 + long T2 FAT : • Large , slow molecules • Lots of bumps • Fast energy loss • Short T1 + Short T2 Mr Blobby Vs Speedy Gonzalez!
Pulse Sequences • Pre-set sequences of excitation, relaxation and signal organization that vary tissue contrast and image quality.
Sag spine T1W Fluid dark Sag spine T2W Fluid bright T1 and T2 weightings
Tissue differentiation • > 99% body tissues produce MR signal • Each tissue has unique properties - molecular structure - number of H+ ions - moving/stationary • Each tissue behaves differently in the MR environment Unique MR signals from normal + abnormal tissues Excellent disease diagnosis.
Tissue contrast : Versatility of MRI T1 SE T2 SE T1 SE + gad GE brain
Tissue contrast : Versatility of MRI Fat sat orbits FLAIR Black blood Angio
Coming up Next !!! Clinical Applications of MRI • MRI Equipment • Safety issues of MRI • Advantages + Disadvantages of MR • MRI vs Other imaging modalities ( CT/ USS) • Clinical Images