Download
1 / 27
580 likes | 1.34k Views
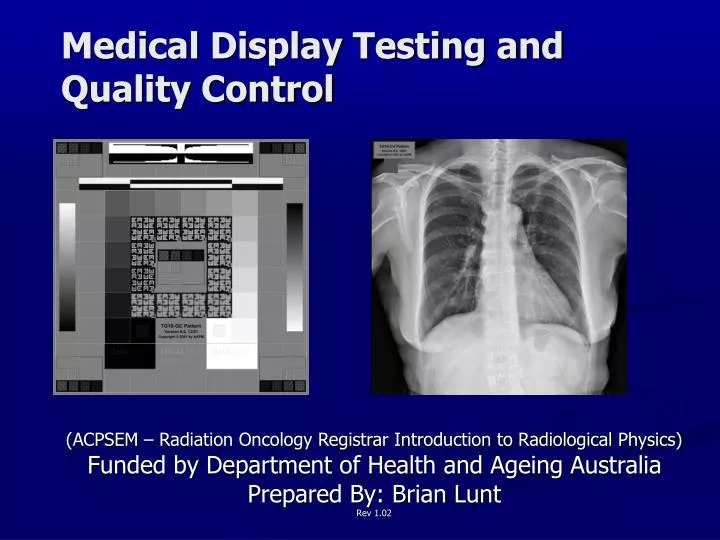
Medical Display Testing and Quality Control. (ACPSEM – Radiation Oncology Registrar Introduction to Radiological Physics) Funded by Department of Health and Ageing Australia Prepared By: Brian Lunt Rev 1.02. Why Do It. Each part of image chain affects image quality

E N D
Medical Display Testing and Quality Control (ACPSEM – Radiation Oncology Registrar Introduction to Radiological Physics) Funded by Department of Health and Ageing Australia Prepared By: Brian Lunt Rev 1.02
Why Do It • Each part of image chain affects image quality • Maintain consistent image appearance • Ensure display is good enough for required task
Display Testing and Quality Assurance • AAPM TG18 Assessment of display performance for medical imaging systems (2005) Online report • IPEM Report 91 Recommended Standards for the Routine Performance Testing of Diagnostic X-ray Imaging Systems • DIN 6868-57, Image quality assurance in diagnostic X-ray departments - Part 57: Acceptance testing for image display devices • IEC 61223 - Constancy tests - Image display devices • DICOM 14 – Grayscale Standard Display Function
Test Tools • Evaluation Hardware • Luminance meter calibration to CIE standard. (To measure monitor luminance at different settings) • Illuminance meter (To measure ambient light) • Evaluation Software • Test Images (e.g TG18, SMPTE) • Data recording • Automated Grayscale setup (GSDF)
Before Testing Prior to testing, the proper placement of a display device should be verified and adjustments made as appropriate. In the placement of a display device, the following should be considered: • Display devices should always be positioned to minimize specular reflection from direct light sources such as ceiling lights, film illuminators, or surgical lamps. The reflection of such light sources should not be observed on the faceplate of the display in the commonly used viewing orientations. • Many display devices, such as CRTs, are affected by magnetic fields; they should not be placed in an area with strong magnetic fields (i.e., in vicinity of MRI scanners), unless properly shielded.
Before testing …cont • Before testing a display device, the device should be warmed up for approximately 30 minutes prior to evaluation so that the electronics can stabilize. • The general system functionality should be verified by a quick review of the TG18-QC test pattern. • Check monitor clean
Luminance Patches • Sixteen 102 × 102 (1k version) luminance patches with pixel values varying from 8 to 248 (in 8-bit version) for luminance response evaluation. Each patch contains four small 10 × 10 corner patches at ±4 of pixel value difference from the background, +4 in upper left and lower right, –4 in lower left and upper right. The small patches are used for visual assessment of luminance response. Additionally, two patches with minimum and maximum pixel value are embedded containing 13, and 242 pixel value internal patches, similar to 5% and 95% areas in the SMPTE test pattern.
Luminance Patches – Min and Max Grey Values • Additionally, two patches with minimum and maximum pixel value are embedded containing 13, and 242 pixel value internal patches, similar to 5% and 95% areas in the SMPTE test pattern.
Line Pairs Pattern Edge enhanced • Line-pair patterns at the center and four corners at Nyquist and half-Nyquist frequencies for resolution evaluation, having pixel values at 0–255 and 128–130
CX Patterns – TG18 “Cx” patterns at the center and four corners with pixel values of 100, 75, 50, and 25% of maximum pixel values against a zero pixel value background, for resolution evaluation in reference to a set of 12 embedded scoring references with various amounts of Gaussian blurring applied
Quick Check Low Contrast Detectability Contrast-detail “QUALITY CONTROL” letters with various contrasts at minimum, midpoint, and maximum pixel values for user-friendly low-contrast detectability at three luminance levels.
Bit Depth & Contouring Artifacts Two vertical bars with continuous pixel value variation for evaluating bit depth and contouring artifacts.
Video Artifacts A horizontal area at the top center of the pattern for visual characterization of cross talk in flat-panel displays. White and black bars for evaluating video signal artifacts, similar to those in the SMPTE pattern.
Ambient Light Don’t underestimate effects of room lighting on monitor/observer performance
DICOM Part 14: Grayscale Standard Display Function • Only applies to part of the imaging chain The Grayscale Standard Display Function is an element of the image Presentation after several modifications to the image have been completed By other elements of the image acquisition and presentation chain. (From DICOM P3.14)
Grayscale Standard Display Function The Grayscale Standard Display Function presented as logarithm-of-Luminance versus JND-Index Just-Noticeable Difference (JND): The Luminance difference of a given target under given viewing conditions that the average human observer can just perceive. Same number of JND = Same perceived contrast Standardized Display System: A device that produce Luminance values which are related to input P-Values by the Grayscale Standard Display Function.
Perceptual Linearization The conceptual model of a standardized display system maps p-values to luminance via an intermediate transformation of digital driving levels (DDLs) of an unstandardized display system. (Ref: AAPM TG18) P-Value: A device independent value defined in a perceptually linear grayscale space. The output of the DICOM Presentation LUT is P-Values, ie. the pixel value after all DICOM defined grayscale transformations have been applied. P-Values are the input to a Standardized Display System. Digital Driving Level (DDL): A digital value which given as input to a Display System produces a Luminance. Characteristic Curve: The inherent Display Function of a Display System including the effects of ambient light. The Characteristic Curve describes Luminance versus DDL of an emissive display device, such as a CRT/display controller system.
Transforming Monitor to Output Conforms to Grayscale Standard Display Function Illustration for determining the transform that changes the Characteristic Curve of a Display System to a Display Function that approximates the Grayscale Standard Display Function (Ref DICOM 3.14)
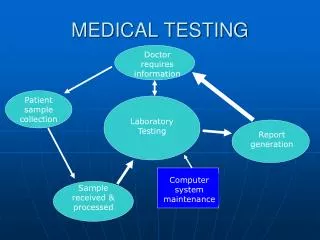
Test Setup In Practice • Automatic – Photometer Built into monitor • Semi Automatic – Commercially Available Photometer software and connection to computer
Summary • Check room lighting and monitor reflections • Clean monitor • Use test image to visually check • Grayscale especially at black and white end of scale • Resolution and geometry • Image bit depth & contouring artifacts • Video and image artifacts, shimmer etc • Use (semi) automated calibration tool to set-up DICOM 14 GSDF
References • AAPM – Assessment of Display Performance For Medical Imaging Systems 2005 • Digital Imaging and Communications in Medicine (DICOM) Part 14: Grayscale Standard Display Function • IPEM Report 91 Recommended Standards for Routine Performance Testing of Diagnostic X-ray Imaging Systems