Download
1 / 19
190 likes | 342 Views
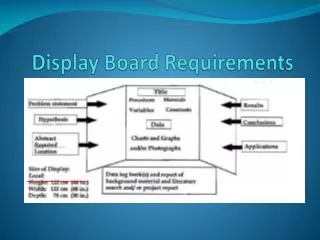
Stress Testing Data and Display Requirements. Stress: Protocol and Stage. Uses exercise or medication to increase the work of the heart – incremental stages Continuous 12 lead ECG monitoring during study Looking for changes in ECG (ST segments) or other clinical indicators. Procedure

E N D
Stress: Protocol and Stage • Uses exercise or medication to increase the work of the heart – incremental stages • Continuous 12 lead ECG monitoring during study • Looking for changes in ECG (ST segments) or other clinical indicators Procedure Protocol Stages
Stress: Protocol and Stage • Procedure : Exercise Stress • Protocol: Bruce • Stages: • Standard Bruce has 7 stages • Stage 1: 1.7 mph @ 10 % grade • Stage 7: 6.0 mph @ 22 % grade Important Note: A procedure can be considered complete irrespective of the patient reaching the last protocol stage!
Acquisition Modalities • Echo – label images by stage and view • Nuclear – format and label images in accordance with NM Image Profile • Stress ECG – output waveforms and results as DICOM objects • DICOM 12-lead and general ECG • Structured Reports • Encapsulated PDF • All modalities – synchronized time, modality worklist and performed procedure step status
Stage and Views • Stress Echo • Stage Number & View Number • Stage Code Sequence & View Code Sequence – SNOMED codes
Image Manager / Image Archive • Must support all stress data objects • Echo, nuclear images • Multi-frame secondary capture images • 12-lead and general ECG • Structured Reports – Enhanced, Comprehensive, Procedure Log • Encapsulated PDF
Image Display • Must display all stress data objects • Echo images – quad screen based on image labels • Nuclear images – ACC/ASNC layout • Multi-frame secondary capture images • 12-lead and general ECG • Structured Reports – Enhanced, Comprehensive, Procedure Log • Encapsulated PDF • Additional display requirements for SR in Evidence Documents Profile Stress Option
Nuclear Cardiology • Image formats • Stress and Rest raw data review • Stress and Rest processed data • Gated SPECT data • Quantitative data • Screen captures, “snap shots” • Color maps • Gray scale is default • Color overlays can be applied
Perfusion Display • Standard perfusion display • Stress/Rest • Short axis • Horizontal long axis • Vertical long axis
Perfusion Display - Color • Standard perfusion display • Stress/Rest • Short axis • Horizontal long axis • Vertical long axis • Color map can be overlaid on the image
Gated SPECT Display • Apical, mid and basal short axis slices • Mid-ventricle vertical and horizontal long axis slices
Gated SPECT Display • The whole screen can be gated as an option
Quantitative Display • Output from 3rd party quantitative perfusion software can be displayed
Quantitative Display • Output from 3rd party quantitative gated software can be displayed
Screen Captures • Screen captures can be displayed to show important images