Download
1 / 11
110 likes | 263 Views
A. B. C. D. Figure 1. 40 m M Quercetin. 20 m M Quercetin. 60 m M Quercetin. Control. 60 m M Q 20 nM B. 40 m M Q 20 nM B. Bortezomib. 20 m M Q 20 nM B. A. B. HRC57. DoHH2. U266. RPMI-8226. Figure 2 A and B. C. HRC57. DoHH2. U266. RPMI-8226. Figure 2 C. A. B.

E N D
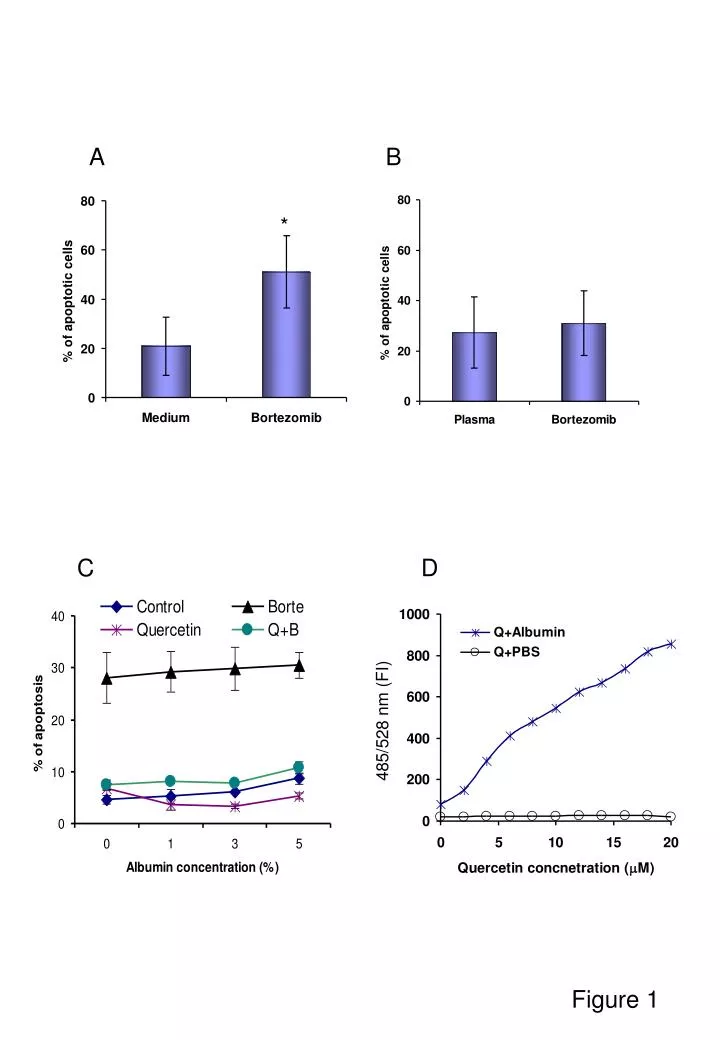
A B C D Figure 1
40 mM Quercetin 20 mM Quercetin 60 mM Quercetin Control 60 mM Q 20 nM B 40 mM Q 20 nM B Bortezomib 20 mM Q 20 nM B A B HRC57 DoHH2 U266 RPMI-8226 Figure 2 A and B
C HRC57 DoHH2 U266 RPMI-8226 Figure 2 C
A B Q 0 20 40 60 0 20 40 60 M B - - - - + + + + CLL Q B Q+B IP IP Active Bax Active Bax b-actin b-actin C Bortezomib Control Quercetin Q+B D Quercetin Bortezomib Q+B Control Figure 3
Control Quercetin Bortezomib Q + B 15% 21% 37% 20% A O2¯ H2O2 B m m 30% 30% 71% 32% C PI Annexin V-FITC Annexin V-FITC Figure 4 A-C
H2O2 O2¯ mLOW Annexin V+ H2O2 O2¯ mLOW Annexin V+ H2O2 O2¯ mLOW Annexin V+ D E F Figure 4 D-F
Control Bortezomib MG-132 10% 30% 54% -NAC O2¯ 22% 40% 22% +NAC H2O2 A Control NAC Bortezomib NAC+B m B 19% 22% 66% 60% Annexin V-FITC C Figure 5
A B Figure 6 A and B
Bortezomib C1 C2 C3 D E Figure 6 C to E
F1 F2 F4 F3 Figure 6 F
A B C Figure 7