Download
1 / 41
410 likes | 595 Views
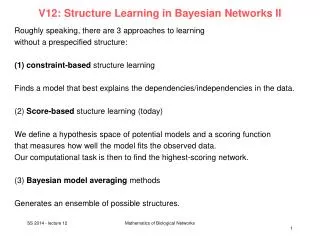
V12: Structure Learning in Bayesian Networks II. Roughly speaking , there are 3 approaches to learning without a prespecified structure : constraint-based structure learning Finds a model that best explains the dependencies / independencies in the data .

E N D
V12: Structure Learning in Bayesian Networks II Roughlyspeaking, thereare 3 approachestolearning without a prespecifiedstructure: • constraint-basedstructurelearning Finds a modelthatbestexplainsthedependencies/independencies in thedata. (2) Score-basedstucturelearning(today) Wedefine a hypothesisspaceof potential modelsand a scoringfunction thatmeasureshowwellthemodelfitstheobserveddata. Ourcomputationaltaskisthento find thehighest-scoringnetwork. (3) Bayesianmodelaveragingmethods Generates an ensembleofpossiblestructures. Mathematics of Biological Networks
BayesianStructureScores Thereare 2 obviouschoicesofscoringfunctions: • Maximum likelihoodparameters (V11) • Bayesianscores (today) Bayesian Score The mainprincipleoftheBayesianapproachisthatwheneverwehave uncertaintyoveranything, weshouldplace a distributionover it. Here, weareuncertainbothaboutthestructureandparametersofthenetwork. Wedefine a structurepriorP(G) thatputs a priorprobability on different graphstructures, and a parameterpriorP(G|G) thatputs a probability on different choicesofparametersoncethegraphisgiven. Mathematics of Biological Networks
Bayesian Score By Bayesrule, wehave The denominator P(D) issimply a normalizingfactorthat does not helpdistinguishingbetween different structures. Thus, wedefinetheBayesian score as The abilitytoascribe a prior P(G) overstructures givesus a wayofpreferringsomestructuresoverothers. E.g. wecouldpenalizedensestructuresmorethansparseones. However, thestructure-prior termisalmost irrelevant comparedtothefirstterm. Mathematics of Biological Networks
Bayesian Score The firstterm P(D|G) takesintoconsiderationouruncertaintyovertheparameters: isthelikelihoodofthedatagiventhenetwork. isourpriordistributionover different parametervaluesforthenetwork G. P(D | G) iscalledthemarginal likelihoodofthedatagiventhestructure. The maximumlikelihood score wouldreturnthemaximumofthisfunction. In contrast, the marginal likelihoodistheaveragevalueofthisfunction. WhydoestheBayesian score avoidoverfitting ? Mathematics of Biological Networks
Bayesian Score Forthisweexaminethesensitivityofthelikelihood totheparticularchoiceofparameters. In V11, wediscussedthatthe maximal likelihood isoverly „optimistic“ in itsevaluationofthe score: itevaluatesthelikelihoodofthetrainingdatausing thebestparametervaluesforthegivendata. This isunrealistic. Mathematics of Biological Networks
Bayesian Score The Bayesianapproachtellsusthat, althoughthechoice ofparameter is themostlikelygiventhetrainingset D, itis not theonlychoice. The posterioroverparametersprovidesus witha rangeofparameterchoices, alongwith a measurehowlikelyeachofthemis. Byintegratingoverthe different choicesofparameters , wearemeasuringtheexpectedlikelihood, averagedover different possiblechoicesof. Thus, wearebeingmoreconservative. Mathematics of Biological Networks
Bayesian Score Using thechainruleforprobabilities, wecanrewritethe marginal likelihoodas Eachoftheterms in thisproductistheprobabilityofthem‘thinstance usingtheparameterslearnedfromthefirst m – 1 instances (usingBayesianestimation). Thus, them‘thinstanceprovidesuswithonedatapointfortesting theabilityofourmodeltopredict a newdatainstance, based on themodellearnedfromthepreviousone. The Bayesian score does not depend on theorderofinstances. Mathematics of Biological Networks
Bayesian Score This suggeststhat is an estimatorfortheaverage log-likelihoodof a newsample X fromthedistribution P*. In practice, itturns out thatforreasonable sample sizes thisisindeed a fairlygoodestimatoroftheability of a modeltogeneralizetounseendata. Mathematics of Biological Networks
Bayesian Score Fig. 18.1 Comparisonoftheaverage log-marginal-likelihood per sample in trainingdata (x-axis) totheexpected log-likelihoodofnewsamples fromtheunderlyingdistribution (y-axis). Eachpointcorrespondsto a networkstructure, thetruenetworkismarkedby a circle. Mathematics of Biological Networks
Marginal likelihoodfor a single variable We startbyexamininghowtocomputethe marginal likelihoodfor simple cases. Consider a simple binaryrandom variable X, andassume thatwehave a priordistributionover X (see V10, p.20). Consider a dataset D with M[1] headsand M[0] tails. Thenthemaximumlikelihoodvaluegiven D is Mathematics of Biological Networks
Marginal likelihoodfor a single variable Nowletusconsiderthe marginal likelihood. Forthis, weneedtocomputetheprobability P(X[1], …, X[M]) ofthedatagivenourprior. Wecan do this e.g. usingthechainrule: Recall from V10 (p.14) thatifweused a Beta prior, then where Mm[1] isthenumberofheads in thefirstmexamples. Mathematics of Biological Networks
Marginal likelihoodfor a single variable For example, if D = H, T, T, H, H, Picking e.g. 1 = 0 = 1 so that = 1+ 0 = 2, weget Figu. 18.2 This issignificantlylower thanthelikelihood Thus, a modelusingmaximum-likelihoodparametersascribes a much higherprobabilitytothesequencethandoesthe marginal likelihood. Mathematics of Biological Networks
Marginal likelihoodfor a single variable In general, for a binomialdistributionwith a Beta prior, wehave A similarformulaholdsfor a multinomialdistributionoverthespacex1, …, xk witha Dirichletpriorwithhyperparameters 1, …, k : Mathematicsof Biological Networks
Bayesian score forBayesiannetworks We nowgeneralizethediscussionoftheBayesian score tomoregeneral BNs. Consider 2 possiblestructuresof 2 binaryrandom variables X and Y. G0isthegraphwithnoedges. Here, wehave The likelihoodtermcanbewrittenas a productofterms, oneinvolvingandtheobservationsof X in thedata, andtheotherinvolvingandtheobservationsof Y in thedata. Mathematics of Biological Networks
Bayesian score forBayesiannetworks If we also assumeparameterindependence, thatisthat decomposesas a product then wecansimplifythe integral Sinceweassumedparameterindependence, wewrotethe integral over a productofindependentfunctionsastheproductoftheintegralsofthefunctions. Eachofthe 2 integralsisthe marginal likelihoodof a single variable. Mathematics of Biological Networks
Bayesian score forBayesiannetworks Now considerthenetwork GX → Y = ( X → Y) Ifweagainassumeparameterindependence, wecandecomposethis integral into a productof 3 integrals, eachover a singleparameterfamily. Eachtermcanbewrittenusingtheclosed form solution, seeDirichletprior (p.13). Mathematics of Biological Networks
Bayesian score forBayesiannetworks Comparingthe marginal likelihoodofthetwostructures G0and GX → Y , weseethatthetermthatcorrespondsto X issimilar in both. In fact, theterms and both makethe same predictionsgiventheparametervalues. Thus, ifwechoosethepriortobethe same as, thefirstterms in the marginal likelihoodofbothstructuresareidentical. Underthisassumption, thedifferencebetweenthetwo marginal likelihoods is due tothedifferencebetweenthe marginal likelihoodoftheobservationsofY andthe marginal likelihoodsoftheobservationsof Y whenwepartitionourexamplesbased on theobservedvalueof X. Letusnowconsiderwhateffectthecomplexityofthenetworkhas. Mathematics of Biological Networks
Bayesian score forBayesiannetworks Weconsider an idealizedexperimentwheretheempiricaldistributionis such that P( x1 ) = 0.5 and P(y1 | x1) = 0.5 + pand P(y1 | x0 ) = 0.5 - p . pis a freeparameter. Larger valuesofpimplystrongerdependencebetween X and Y. The marginal distributionsof X and Y arethe same regardlessofthevalueofp. Thus, the score oftheemptygraph G0does not depend on p. But the score ofthestructureGX→Y depends on p. The figureillustrateshow thescoreschangedepending onthe numberoftrainingsamples. As wegetmoredata, theBayesian score prefersthestructureGX→Ywhere X and Y aredependent. Mathematics of Biological Networks
Bayesian score forBayesiannetworks But ifthedependencebecomesweaker (smallerp values), moredataareneededtoestablishthispreference. Proposition: Let G be a networkstructureandlet P( G | G ) be a parameterpriorsatisfying global parameterindependence. Then . The Bayesian score isbiasedtowards simpler structures. But asitgetsmoredata, itiswillingtorecognizethat a morecomplexstructure isnecessary. Itappearstotrade off the fit todatawithmodelcopmlexity. Mathematics of Biological Networks
Practicalexampleofparameterlearning:Stochastic Dynamics simulationsof a photosyntheticvesicle I Introduction: prelude photosynthesis II Process view and geometric model of a chromatophore vesicle Tihamér Geyer & V. Helms (Biophys. J. 2006a, 2006b) III Stochastic dynamics simulations T. Geyer, Florian Lauck & V. Helms (J. Biotechnol. 2007) IV Parameter fit through evolutionary algorithm T. Geyer, X. Mol, S. Blaß & V. Helms (PLoS ONE 2010)
Bacterial Photosynthesis 101 ATPase Photons Reaction Center chemical energy e––H+–pairs light energy outside inside Light Harvesting Complexes cytochrome bc1complex ubiquinon cytochrome c2 electronic excitation H+ gradient; transmembrane potential electron carriers Okamura group, May 31, 2007
Viewing the photosynthetic apparatus as a conversion chain Thick arrows : path through which the photon energy is converted into chemical energy stored in ATP via the intermediate stages (rounded rectangles). Each conversion step takes place in parallely working proteins. Their number N times the conversion rate of a single protein R determines the total throughput of this step. : incoming photons collected in the LHCs E : excitons in the LHCs and in the RC e−H+ electron–proton pairs stored on the quinols e− for the electrons on the cytochrome c2 pH : transmembrane proton gradient H+ : protons outside of the vesicle (broken outine of the respective reservoir).
Stochastic dynamics simulations: Molecules & Pools model Round edges: pools for metabolite molecules Rectangles: protein machines are modeled explicitly as multiple copies fixed set of parameters integrate rate equations with stochastic algorithm
Include stochastic effects (Consequence1) modeling of reactions as continuous fluxes of matter is no longer correct. (Consequence2) Significant stochastic fluctuations occur. To study the stochastic effects in biochemical reactions, stochastic formulations of chemical kinetics and Monte Carlo computer simulations have been used. Daniel Gillespie (J Comput Phys 22, 403 (1976); J Chem Phys 81, 2340 (1977)) introduced the exact Dynamic Monte Carlo (DMC) method that connects the traditional chemical kinetics and stochastic approaches.
Basic outline of the direct method of Gillespie (Step i) generate a list of the components/species and define the initial distribution at time t = 0. (Step ii) generate a list of possible events Ei (chemical reactions as well as physical processes). (Step iii) using the current component/species distribution, prepare a probability table P(Ei) of all the events that can take place. Compute the total probability P(Ei) : probability of event Ei. (Step iv) Pick two random numbers r1 and r2 [0...1] to decide which event E will occur next and the amount of time after which E will occur. Resat et al., J.Phys.Chem. B 105, 11026 (2001)
Basic outline of the direct method of Gillespie Using the random number r1 and the probability table, the event E is determined by finding the event that satisfies the relation The second random number r2 is used to obtain the amount of time between the reactions As the total probability of the events changes in time, the time step between occurring steps varies. Steps (iii) and (iv) are repeated at each step of the simulation. The necessary number of runs depends on the inherent noise of the system and on the desired statistical accuracy. Resat et al., J.Phys.Chem. B 105, 11026 (2001)
Stochastic simulations of a complete vesicle Model vesicle: 12 LH1/RC-monomers 1-6 bc1complexes 1 ATPase 120 quinones 20 cytochrome c2 integrate rate equations with: - Gillespie algorithm (associations) - Timer algorithm (reactions); 1 random number determines when reaction occurs simulating 1 minute real time requires 1.5 minute on one opteron 2.4 GHz proc
simulate increase of light intensity (sunrise) during 1 minute, light intensity is slowly increased from 0 to 10 W/m2 (quasi steady state) there are two regimes - one limited by available light - one limited by bc1 throughput low light intensity: linear increase of ATP production with light intensity high light intensity: saturation is reached the later the higher the number of bc1 complexes
oxidation state of cytochrome c2 pool low light intensity: all 20 cytochrome c2 are reduced by bc1 high light intensity RCs are faster than bc1, c2s wait for electrons
oxidation state of cytochrome c2 pool more bc1 complexes can load more cytochrome c2s
total number of produced ATP blue line: illumination low light intensity: any interruption stops ATP production high light intensity: interruptions are buffered up to 0.3 s duration
c2 pool acts as buffer At high light intensity, c2 pool is mainly oxidized. If light is turned off, bc1 can continue to work (load c2s, pump protons, let ATPase produce ATP) until c2 pool is fully reduced.
What if parameters are/were unknown ? PLoS ONE (2010) choose 25 out of 45 system parameters for optimization. take 7 different non-equilibrium time-resolved experiments from Dieter Oesterhelt lab (MPI Martinsried).
25 optimization parameters Analyze 1000 best parametersetsamong 32.800 simulations:
Sensitivity of master score Decay rate of excitons in LHC Absorption cross section light harvesting complex Kinetic rate for hinge motion of FeS domain in bc1 complex Some parameters are very sensitive, others not.
Threebest-scoredparameter sets Score of individual parameter set i for matching one experiment: x(ti): simulation result f(ti): smooth fit of exp. data Master score for one parameter set: defined as product of the individual scores si
Different experiments yield different sensitivity ‘‘importance score’’: Sum of the sensitivities Pmin /Pmaxof all relevant parameters Analysis could suggest new experiments that would be most informative!
Summary Only 1/3 of the kinetic parameters previously known. Stochastic parameter optimization converges robustly into the same parameter basin as known from experiment. Two large-scale runs (15 + 17 parameters) yielded practically the same results. If implemented as grid search, less than 2 points per dimension. It appears enough to know 1/3 – 1/2 of kinetic rates about a system to be able to describe it quantitatively (IF connectivities are known).