Download
1 / 61
610 likes | 718 Views
Understanding the Concept of Present Value. Interest Rates, Compounding, and Present Value. In economics, an interest rate is known as the yield to maturity. Compounding is the process that gives us the value of a sum invested over time at a positive rate of interest.

E N D
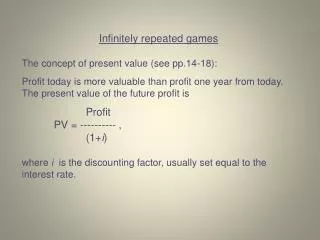
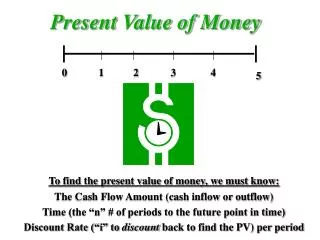
Interest Rates, Compounding, and Present Value • In economics, an interest rate is known as the yield to maturity. • Compounding is the process that gives us the value of a sum invested over time at a positive rate of interest. • Present value is the process that tells us how much an expected future payment is worth today.
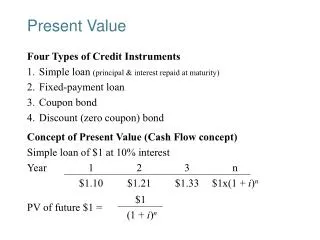
Compounding • Assume you have $1 which you place in an account paying 10% annually. • How much will you have in one year, two years, etc? • An amount of $1 at 10% interest • Year 1 2 3 n • $1.10 $1.21 $1.33 $1(1 + i)n • Formula: FV = PV(1 + i)
Compounding over Time • Extending the formula over 2 years • FV = PV(1 + i) (1 + i) or FV = PV(1 + i)2 • 3 years • FV = PV(1 + i) (1 + i) (1 + i) = PV(1 + i)3 • n years • FV = PV(1 + i)n
Present Value • Present value tells us how much an expected future payment is worth today. • Alternatively, it tells us how much we should be willing to pay today to receive some amount in the future. • For example, if the present value of $1.10 at an interest rate of 10% is $1, we should be willing to spend $1 today to get $1.10 next year.
Present Value Formula • The formula for present value can be found by rearranging the compounding formula. • FV = PV(1 + i) solve for PV • FV/(1 +i) = PV
Present Value over Time • Extending the formula over 2 years • FV = PV(1 + i)2 • PV = FV/(1 + i)2 • 3 years • FV = PV(1 + i)3 • PV = FV/(1 + i)3 • n years • FV = PV(1 + i)n • PV = FV/(1 + i)n
Things to Notice • An increase in the interest rate causes present value to fall. • Higher rates of interest mean smaller amounts can grow to equal some fixed amount during a specified period of time. • A decrease in the interest rate causes present value to rise. • Lower rates of interest mean larger amounts are needed to reach some fixed amount during a specified period of time.
Example: How much must I invest today to get $10,000 in five years if interest rates are 10%? PV = FV/(1 + i)n PV = $10,000/(1 + .10)5 = $10,000/1.6105 = $6,209.2 How much must I invest today to get $10,000 in five years if interest rates are 5%? PV = FV/(1 + i)n PV = $10,000/(1 + .05)5 = $10,000/1.2763 $7,835.15
More Things to Notice • Present value is always less than future value. • (1 + i)n is positive so FV/(1 + i)n < FV • In addition, PV4 < PV3 < PV2 < PV1 • (1 + i)1 < (1 + i)2 • The longer an amount has to grow to some fixed future amount, the smaller the initial amount needs to be.
Time Value of Money • The longer the time to maturity, the less we need to set aside today. This is the principal lesson of present value. It is often referred to as the “time value of money.”
Example: If I want to receive $10,000 in 5 years, how much do I have to invest now if interest rates are 10%? $10,000 = PV(1 + .10)5 $10,000/1.5105 = $6209.25 If I want to receive $10,000 in 20 years, how much do I have to invest now if interest rates are 10%? $10,000 = PV(1 + .10)20 $10,000/6.7275= $1486.44
Yield to Maturity • Yield to maturity is the interest rate that equates the present value of payments received from a debt instrument with its value today. • Yield to maturity can be calculated using the present value formula. • PV = FV/(1 + i) • i = FV - PV/PV
Simple Example: • PV = FV/(1 + i) • PV(1 + i) = FV • PV + PVi = FV • PVi = FV - PV • i = FV - PV/PV • $1.00 = $1.10/(1 + i) • $1.00 + $1.00i = $1.10 • i = $1.10 - $1.00/$1.00 = 0.10 = 10%
Relationship between Yield to Maturity and Price Yields to maturity on a 10% coupon rate bond with a face value of $1000 maturing in 10 years Price of Bond Yield to Maturity 1200 7.13 1100 8.48 1000 10.00 900 11.75 800 13.81
Relationship between Yield to Maturity and Price • Three interesting facts: • Price and yield are negatively related. • When the bond is at par, yield equals coupon rate. • Yield is greater (less than) than the coupon rate when the bond price is below (above) par value.
Current Yield • In more complicated cases, yield to maturity can be difficult to calculate. Tables are available that can be used. And, of course, calculators do a fine job. • There are also simple formulas that can approximate yield to maturity such as current yield.
Current Yield • Current yield is an approximation for yield to maturity that is used to calculate the interest rate on a bond quickly. • Formula: • Current yield = Coupon/Bond Price
Inverse Relationship • We can use the current yield formula to see clearly the inverse relationship between interest rates and bond prices. • Current yield = Coupon/Bond Price • The coupon is a fixed payment, it does not change. Therefore, if yields rise, bond prices must fall, and if yields fall, bond prices must rise.
Intuition • Assume you buy a $1,000 bond today with a fixed coupon of $100. You are receiving a 10% return. Let a year pass, and you find you want to sell you bond. You call your broker and say, “Sell!” Your broker sighs and tells you that bonds just like yours now yield 12%. What price can you expect to receive?
Example • Use the current yield formula: • 0.12 = $100/PB • 0.12PB = $100 • PB = $100/.12 = $833.33 • You must reduce your price until $100 represents a 12% rate of return.
The Behavior of Interest Rates The Bond Market Model
Understanding Interest Rates • Economists use three different models to explain how interest rates are determined. • The bond market model • The money demand/money supply model • The loanable funds model
The Bond Market Model • The bond market model is useful because of the issues that can be considered within its framework. • The impact of changes in---- • Wealth • Expected interest rates or expected return • Expected inflation • Riskiness of bonds relative to other assets • Liquidity of bonds relative to other assets
The Bond Market Model • The bond market can be modeled using the concepts of demand and supply. • The demand for bonds is determined by individuals and institutions who wish to hold their wealth in bonds. • The supply of bonds is provided by institutions that issue bonds to raise funds.
The Demand for Bonds • The demand for bonds comes from savers, people who have funds in excess of their spending needs. • They are willing to hold bonds for two reasons: • Interest earned • Potential capital gains
Bond Demand • Rate of return • According to the asset theory of demand, people compare one asset relative to another and choose the one that best suits their needs. • As the opportunity cost of an asset increases, people find it increasingly unattractive.
Opportunity Cost • The opportunity cost of an asset is defined as the difference between the rate of return received by the asset and the rate of return on an alternative asset. • When bond yields are high, people prefer bonds because the opportunity cost of holding other assets is high. • When bond yields are low, people prefer other assets because the opportunity cost of holding bonds is high.
Bond Demand • Investors who demand bonds based on opportunity cost considerations prefer to buy when interest rates are high and sell when interest rates are low.
Bond Demand • Speculation • When choosing an asset, investors also consider risk. • Interest rate risk occurs when the market value of a bond falls because interest rates rise. • As we have seen, the existence of interest rate risk means investors face the possibility of capital losses when interest rates rise and capital gains when interest rates fall.
Speculation • Investors who speculate in the bond market prefer to buy when interest rates are high and sell when interest rates are low. • When interest rates are high, people expect them to fall. As they fall, bond prices rise, yielding a capital gain. • When interest rates are low, people expect them to rise. As they rise, bond prices fall, diminishing capital gains or yielding a capital loss.
Bond Demand • Both the opportunity cost motive and the speculative motive result in investors demanding bonds when interest rates are high and selling bonds when interest rates are low.
The Demand Curve for Bonds • Let r = RET = (F - P)/P • If F = $1,000 and P = $950, r = 5.26% • If F = $1,000 and P = $900, r = 11.1% • High bond prices are associated with low interest rates. • Low bond prices are associated with high interest rates.
The Demand Curve for Bonds 0 Bond Price Interest Rate When bond prices are high, interest rates are low, and bond demand is low. When bond prices are low, interest rates are high, and bond demand is high. ilow PBhigh PBlow ihigh Demand 0 QDlow QDhigh
Bond Supply • The supply of bonds comes from institutions, governments (domestic and foreign), and businesses. • The quantity of bonds supplied depends in part on the interest rate bond suppliers must pay to attract funds. • As interest rates increase, the quantity supplied falls. • As interest rates decrease, the quantity supplied rises.
The Supply Curve for Bonds 0 Bond Price Interest Rate Supply As bond prices rise, bond yields fall, and quantity supplied rises. As bond prices fall, bond yields rise, and quantity supplied falls. ilow PBhigh PBlow ihigh 0 QSlow QShigh
Equilibrium • Equilibrium is a state of rest. Either there are no forces causing change or there are equal opposing forces. • In the bond market, equilibrium occurs when the quantity of bonds demanded just equals the quantity of bonds supplied.
Equilibrium & Disequilibrium 0 Bond Price Interest Rate S Excess supply occurs when bond prices are high and interest rates are low. Excess demand occurs when bond prices are low and interest rates are high. A B ilow PBhigh E PBeq ieq ihigh PBlow F G D 0 100 300 500
Disequilibrium • Excess Supply • More people want to sell bonds than want to buy them. • Bond prices fall and interest rates rise. • Excess Demand • More people want to buy bonds than want to sell them. • Bond prices rise and interest rates fall.
Mechanics of an Increase in Demand 0 Bond Price Interest Rate S b Increases in bond demand cause bond prices to rise and bond yields to fall. P2 i1 a P1 i2 D2 D1 0 Q1 Q2
Mechanics of a Decrease in Demand 0 Bond Price Interest Rate S Decreases in bond demand cause bond prices to fall and bond yields to rise. a P1 i2 b P2 i1 D1 D2 0 Q2 Q1
Shifts in the Demand for Bonds • According to the asset theory of demand, changes in bond demand are caused by changes in--- • Wealth • Expected return on bonds relative to expected returns on other assets • Expected riskiness of bonds relative to other assets • Liquidity of bonds relative to other assets.
Bond Demand and Wealth • Wealth is defined as a stock of assets that produce income. Wealth is not income. • In a business cycle expansion, wealth grows, causing the demand for bonds to rise and the demand curve to shift to the right. • In a business cycle contraction, wealth shrinks, causing the demand for bonds to fall and the demand curve to shift to the left.
Bond Demand and Expected Returns: Bonds • Higher expected interest rates in the future decrease the demand for long-term bonds and shift the demand curve to the left. • Lower expected interest rates in the future increase the demand for long-term bonds and shift the demand curve to the right.
Returns on Different Maturity 10% Coupon Rate Bonds Term Initial i Initial P New i New P 30 10% 1000 20% 503 20 10% 1000 20% 516 10 10% 1000 20% 597 5 10% 1000 20% 741 1 10% 1000 20% 1000
Bond Demand and Expected Returns: Other Assets • Higher expected returns on other assets relative to bonds cause bonds to become less attractive and the bond demand curve shifts left. • Lower expected returns on other assets relative to bonds cause bonds to become more attractive and the bond demand curve shifts right.
Bond Demand and Expected Returns: Inflation • An increase in the expected rate of inflation will cause the demand for bonds to decline and the demand curve to shift to the left. • A decrease in the expected rate of inflation will cause the demand for bonds to increase and the demand curve to shift to the right.
Bond Demand and Risk • An increase in the riskiness of bonds causes the demand for bonds to fall and the demand curve to shift to the left. • An increase in the riskiness of other assets causes the demand for bonds to rise and the demand curve to shift to the right.
Bond Demand and Liquidity • Increased liquidity of bonds results in an increased demand for bonds and the demand curve shifts right. • Increased liquidity of other assets results in a decreased demand for bonds and the demand curve shifts left.
Bond Demand and Liquidity • Increased liquidity of bonds results in an increased demand for bonds and the demand curve shifts right. • Increased liquidity of other assets results in a decreased demand for bonds and the demand curve shifts left.