Download
1 / 20
200 likes | 204 Views
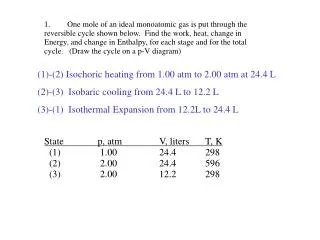
P $5.00 $4.50 $4.00 $3.50 $3.00 $2.50 $2.00 $1.50 $1.00. Qs 100 95 88 79 68 52 39 25 20. Qd 10 15 21 26 33 41 53 70 95. ???. In a market with no government interference, what will the price of a widget end up being?. P. $5.00 $4.00 $3.00 $2.00 $1.00. S. D.

E N D
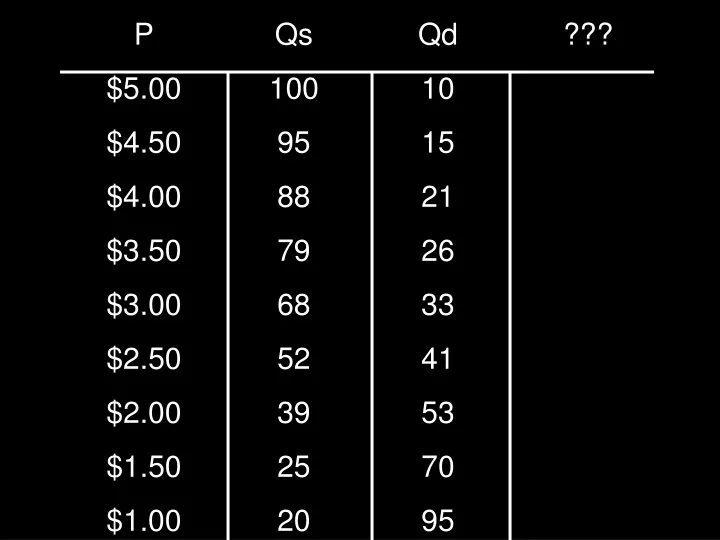
P $5.00 $4.50 $4.00 $3.50 $3.00 $2.50 $2.00 $1.50 $1.00 Qs 100 95 88 79 68 52 39 25 20 Qd 10 15 21 26 33 41 53 70 95 ???
In a market with no government interference, what will the price of a widget end up being?
P $5.00 $4.00 $3.00 $2.00 $1.00 S D Q 20 40 60 80 100 Equilibrium Point Qs = Qd
Do suppliers automatically know where equilibrium is, and charge that price all the time? • What happens if they charge a price that is higher or lower than equilibrium?
P $5.00 $4.50 $4.00 $3.50 $3.00 $2.50 $2.00 $1.50 $1.00 Qs 100 95 88 79 68 52 39 25 20 Qd 10 15 21 26 33 41 53 70 95 Surplus / Shortage 90 80 67 53 35 11 -14 -45 -75
How do I know if the equilibrium price and quantity I have calculated are correct? P $5.00 $4.00 $3.00 $2.00 $1.00 S D QE = 46 Q 20 40 60 80 100 PE = $2.30
Qs – Qd = 0 PE P $5.00 $4.50 $4.00 $3.50 $3.00 $2.50 $2.00 $1.50 $1.00 Qs 100 95 88 79 68 52 39 25 20 Qd 10 15 21 26 33 41 53 70 95 Surplus / Shortage 90 80 67 53 35 11 -14 -45 -75
7 Reasons for a change in supply 1. Change in the cost of inputs • Land, labor, capital 2. Change in Productivity 3. Change in Technology • Ask Henry Ford… 4. Change in Number of Sellers • Duh.
7 Reasons for a change in supply • 5. Change in Taxes or Subsidies • 6. Change in Market Expectations • Future prices/demand/conditions • 7. Change in Government Regulation
Change in Demand • Change in Income mo’ money = mo’ problems purchases • Change in Prices and Availability of Substitutes ex: Pens and Pencils • Change in Prices and Availability of Complements ex: Paper and Pencils • Change in Weather or Seasons ex: Shorts in winter, Sleds in summer, Gas? • Change in Number of Buyers ex: larger/smaller market, population change, technology • Change in Styles, Tastes, Habits, Preferences fashion, coolness, trends – ex: • Change in Expectations future oriented – ex: harvest, technology
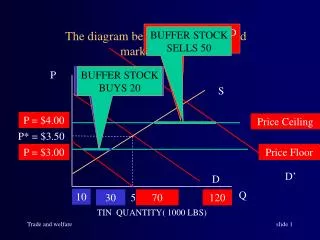
Price Controls • Price Floor • Price Ceiling • Price Fixing
Price Fixing • If the government fixes a price above equilibrium, it acts as a price floor. • If the government fixes a price below equilibrium, it acts as a price ceiling.
Price Floor P $5.00 $4.00 $3.00 $2.00 $1.00 S D Q 20 40 60 80 100 Surplus of 45 PF = $3.25
Price Floors • Effect: Surplus • Why set them? • To compel production • Examples: Agriculture, Minimum Wage • Double Whammy: • Consumers pay more • Taxpayers can take a hit • Overallocation of resources • No allocative and productive efficiency
Price Ceiling P $5.00 $4.00 $3.00 $2.00 $1.00 S D Q 20 40 60 80 100 PC= $1.25 Shortage of 59
Price Ceilings • Effect: Shortage • Why set them? • Social reasons – keep consumers from being rationed out of the market (especially for needs) • Examples: Rent controls, Electricity • Black Market!!! • Underallocation of Resources • No allocative or productive efficiency