Download
1 / 4
40 likes | 160 Views
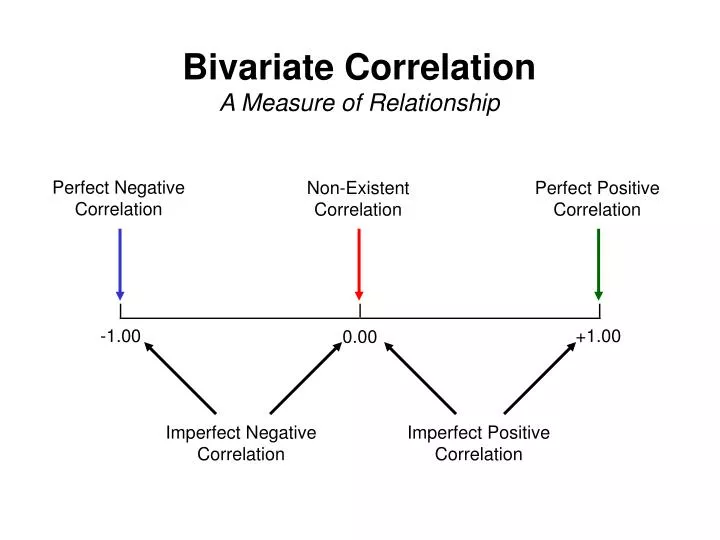
Perfect Negative Correlation. Non-Existent Correlation. Perfect Positive Correlation. -1.00. +1.00. 0.00. Imperfect Negative Correlation. Imperfect Positive Correlation. Bivariate Correlation A Measure of Relationship. Bivariate Correlation A Measure of Relationship.

E N D
Perfect Negative Correlation Non-Existent Correlation Perfect Positive Correlation -1.00 +1.00 0.00 Imperfect Negative Correlation Imperfect Positive Correlation Bivariate Correlation A Measure of Relationship
Bivariate Correlation A Measure of Relationship The correlation coefficient (r) is an index that describes the extent to which two sets of data are related; it is a measure of the relationship between two variables and ranges in values between -1.00 and +1.00, inclusive. The sign indicates the direction of the relationship, where a plus (+) indicates a positive relationship, and a negative (-) indicates a negative relationship. The absolute value of the coefficient indicates the magnitude of the relationship. A perfect positive (direct) correlation coefficient is +1.00. A positive relationship indicates that as one score goes up, the other score goes up – or – as one score goes down, the other score goes down. That is, the value on one variable follows the value on the other. A perfect negative (inverse) correlation coefficient is -1.00. A negative relationship indicates that as one score goes up, the other score goes down. When there is no relationship between two variables – the correlation coefficient is 0.00 (zero). All other possible values (i.e., excluding +1.00, -1.00, and 0.00) are considered imperfect relationships (both positive and negative).
Bivariate Correlation A Measure of Relationship Upper Diagonal (UD) Highest/Strongest Lowest/Weakest Lower Diagonal (LD)
Variable Y Variable X X Y r2 Coefficient of Determination (r squared: r2) r = 0.50 r2 = 0.25 The proportion of the total variance in Y that can be associated with the variance in X.