Download
1 / 1
10 likes | 102 Views
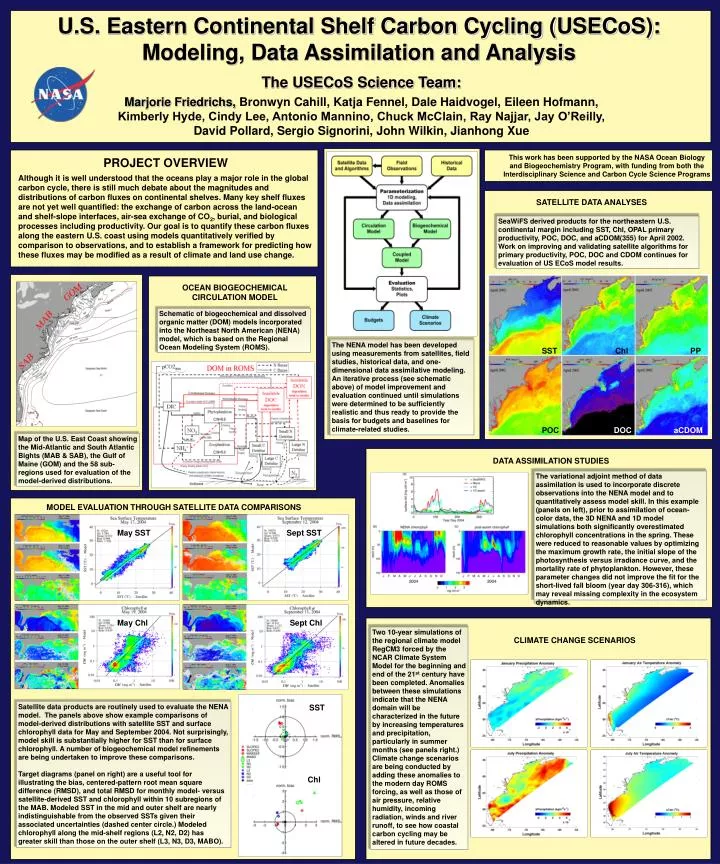
U.S. Eastern Continental Shelf Carbon Cycling (USECoS): Modeling, Data Assimilation and Analysis. This project is supported by the NASA Interdisciplinary Science Program. The USECoS Science Team:

E N D
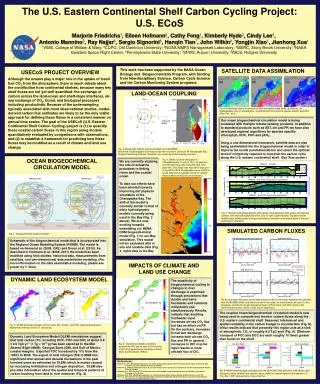
U.S. Eastern Continental Shelf Carbon Cycling (USECoS): Modeling, Data Assimilation and Analysis This project is supported by the NASA Interdisciplinary Science Program The USECoS Science Team: Marjorie Friedrichs, Bronwyn Cahill, Katja Fennel, Dale Haidvogel, Eileen Hofmann, Kimberly Hyde, Cindy Lee, Antonio Mannino, Chuck McClain, Ray Najjar, Jay O’Reilly, David Pollard, Sergio Signorini, John Wilkin, Jianhong Xue This work has been supported by the NASA Ocean Biology and Biogeochemistry Program, with funding from both the Interdisciplinary Science and Carbon Cycle Science Programs PROJECT OVERVIEW Although it is well understood that the oceans play a major role in the global carbon cycle, there is still much debate about the magnitudes and distributions of carbon fluxes on continental shelves. Many key shelf fluxes are not yet well quantified: the exchange of carbon across the land-ocean and shelf-slope interfaces, air-sea exchange of CO2, burial, and biological processes including productivity. Our goal is to quantify these carbon fluxes along the eastern U.S. coast using models quantitatively verified by comparison to observations, and to establish a framework for predicting how these fluxes may be modified as a result of climate and land use change. v SATELLITE DATA ANALYSES SeaWiFS derived products for the northeastern U.S. continental margin including SST, Chl, OPAL primary productivity, POC, DOC, and aCDOM(355) for April 2002. Work on improving and validating satellite algorithms for primary productivity, POC, DOC and CDOM continues for evaluation of US ECoS model results. OCEAN BIOGEOCHEMICAL CIRCULATION MODEL Schematic of biogeochemical and dissolved organic matter (DOM) models incorporated into the Northeast North American (NENA) model, which is based on the Regional Ocean Modeling System (ROMS). The NENA model has been developed using measurements from satellites, field studies, historical data, and one-dimensional data assimilative modeling. An iterative process (see schematic above) of model improvement and evaluation continued until simulations were determined to be sufficiently realistic and thus ready to provide the basis for budgets and baselines for climate-related studies. SST Chl PP POC DOC aCDOM Map of the U.S. East Coast showing the Mid-Atlantic and South Atlantic Bights (MAB & SAB), the Gulf of Maine (GOM) and the 58 sub-regions used for evaluation of the model-derived distributions. DATA ASSIMILATION STUDIES The variational adjoint method of data assimilation is used to incorporate discrete observations into the NENA model and to quantitatively assess model skill. In this example (panels on left), prior to assimilation of ocean-color data, the 3D NENA and 1D model simulations both significantly overestimated chlorophyll concentrations in the spring. These were reduced to reasonable values by optimizing the maximum growth rate, the initial slope of the photosynthesis versus irradiance curve, and the mortality rate of phytoplankton. However, these parameter changes did not improve the fit for the short-lived fall bloom (year day 306-316), which may reveal missing complexity in the ecosystem dynamics. MODEL EVALUATION THROUGH SATELLITE DATA COMPARISONS May SST Sept SST May Chl Sept Chl Two 10-year simulations of the regional climate model RegCM3 forced by the NCAR Climate System Model for the beginning and end of the 21st century have been completed. Anomalies between these simulations indicate that the NENA domain will be characterized in the future by increasing temperatures and precipitation, particularly in summer months (see panels right.) Climate change scenarios are being conducted by adding these anomalies to the modern day ROMS forcing, as well as those of air pressure, relative humidity, incoming radiation, winds and river runoff, to see how coastal carbon cycling may be altered in future decades. CLIMATE CHANGE SCENARIOS Satellite data products are routinely used to evaluate the NENA model. The panels above show example comparisons of model-derived distributions with satellite SST and surface chlorophyll data for May and September 2004. Not surprisingly, model skill is substantially higher for SST than for surface chlorophyll. A number of biogeochemical model refinements are being undertaken to improve these comparisons. Target diagrams (panel on right) are a useful tool for illustrating the bias, centered-pattern root mean square difference (RMSD), and total RMSD for monthly model- versus satellite-derived SST and chlorophyll within 10 subregions of the MAB. Modeled SST in the mid and outer shelf are nearly indistinguishable from the observed SSTs given their associated uncertainties (dashed center circle.) Modeled chlorophyll along the mid-shelf regions (L2, N2, D2) has greater skill than those on the outer shelf (L3, N3, D3, MABO). SST Chl