Download
1 / 1
10 likes | 84 Views
The U.S. Eastern Continental Shelf Carbon Cycling Project: U.S . ECoS. This project is supported by the NASA Interdisciplinary Science Program. Marjorie Friedrichs 1 , Eileen Hofmann 2 , Cathy Feng 1 , Kimberly Hyde 3 , Cindy Lee 4 ,

E N D
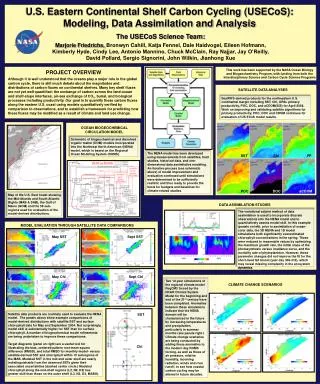
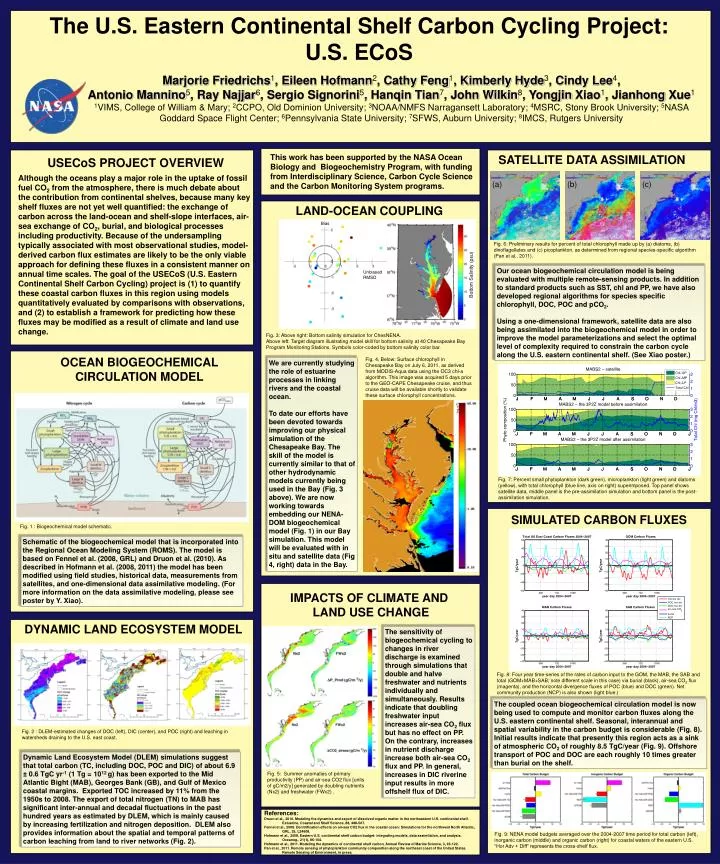
The U.S. Eastern Continental Shelf Carbon Cycling Project: U.S. ECoS This project is supported by the NASA Interdisciplinary Science Program Marjorie Friedrichs1, Eileen Hofmann2, Cathy Feng1, Kimberly Hyde3, Cindy Lee4, Antonio Mannino5, Ray Najjar6, Sergio Signorini5, Hanqin Tian7, John Wilkin8, Yongjin Xiao1, Jianhong Xue1 1VIMS, College of William & Mary; 2CCPO, Old Dominion University; 3NOAA/NMFS Narragansett Laboratory; 4MSRC, Stony Brook University; 5NASA Goddard Space Flight Center; 6Pennsylvania State University; 7SFWS, Auburn University; 8IMCS, Rutgers University This work has been supported by the NASA Ocean Biology and Biogeochemistry Program, with funding from Interdisciplinary Science, Carbon Cycle Science and the Carbon Monitoring System programs. SATELLITE DATA ASSIMILATION USECoS PROJECT OVERVIEW Although the oceans play a major role in the uptake of fossil fuel CO2 from the atmosphere, there is much debate about the contribution from continental shelves, because many key shelf fluxes are not yet well quantified: the exchange of carbon across the land-ocean and shelf-slope interfaces, air-sea exchange of CO2, burial, and biological processes including productivity. Because of the undersampling typically associated with most observational studies, model-derived carbon flux estimates are likely to be the only viable approach for defining these fluxes in a consistent manner on annual time scales. The goal of the USECoS (U.S. Eastern Continental Shelf Carbon Cycling) project is (1) to quantify these coastal carbon fluxes in this region using models quantitatively evaluated by comparisons with observations, and (2) to establish a framework for predicting how these fluxes may be modified as a result of climate and land use change. (a) (b) (c) LAND-OCEAN COUPLING Bias Fig. 6: Preliminary results for percent of total chlorophyll made up by (a) diatoms, (b) dinoflagellates and (c) picoplankton, as determined from regional species-specific algorithm (Pan et al., 2011). Our ocean biogeochemical circulation model is being evaluated with multiple remote-sensing products. In addition to standard products such as SST, chl and PP, we have also developed regional algorithms for species specific chlorophyll, DOC, POC and pCO2. Using a one-dimensional framework, satellite data are also being assimilated into the biogeochemical model in order to improve the model parameterizations and select the optimal level of complexity required to constrain the carbon cycle along the U.S. eastern continental shelf. (See Xiao poster.) Unbiased RMSD Bottom Salinity (psu) Fig. 3: Above right: Bottom salinity simulation for ChesNENA. Above left: Target diagram illustrating model skill for bottom salinity at 40 Chesapeake Bay Program Monitoring Stations. Symbols color-coded by bottom salinity color bar. OCEAN BIOGEOCHEMICAL CIRCULATION MODEL Fig. 4, Below: Surface chlorophyll in Chesapeake Bay on July 6, 2011, as derived from MODIS-Aqua data using the OC3 chl-a algorithm. This image was acquired 5 days prior to the GEO-CAPE Chesapeake cruise, and thus cruise data will be available shortly to validate these surface chlorophyll concentrations. We are currently studying the role of estuarine processes in linking rivers and the coastal ocean. To date our efforts have been devoted towards improving our physical simulation of the Chesapeake Bay. The skill of the model is currently similar to that of other hydrodynamic models currently being used in the Bay (Fig. 3 above). We are now working towards embedding our NENA-DOM biogeochemical model (Fig. 1) in our Bay simulation. This model will be evaluated with in situ and satellite data (Fig 4, right) data in the Bay. Fig. 7: Percent small phytoplankton (dark green), microplankton (light green) and diatoms (yellow), with total chlorophyll (blue line, axis on right) superimposed. Top panel shows satellite data, middle panel is the pre-assimilation simulation and bottom panel is the post-assimilation simulation. SIMULATED CARBON FLUXES Fig. 1 : Biogeochemical model schematic. Schematic of the biogeochemical model that is incorporated into the Regional Ocean Modeling System (ROMS).The model is based on Fennel et al. (2008, GRL) and Druon et al. (2010). As described in Hofmann et al. (2008, 2011) the model has been modified using field studies, historical data, measurements from satellites, and one-dimensional data assimilative modeling. (For more information on the data assimilative modeling, please see poster by Y. Xiao). IMPACTS OF CLIMATE AND LAND USE CHANGE DYNAMIC LAND ECOSYSTEM MODEL The sensitivity of biogeochemical cycling to changes in river discharge is examined through simulations that double and halve freshwaterand nutrients individually and simultaneously. Results indicate that doubling freshwater input increases air-sea CO2 flux but has no effect on PP. On the contrary, increases in nutrient discharge increase both air-sea CO2 flux and PP. In general, increases in DIC riverine input results in more offshelf flux of DIC. Fig. 8: Four year time-series of the rates of carbon input to the GOM, the MAB, the SAB and total (GOM+MAB+SAB; note different scale in this case) via burial (black), air-sea CO2 flux (magenta), and the horizontal divergence fluxes of POC (blue) and DOC (green). Net community production (NCP) is also shown (light blue.) The coupled ocean biogeochemical circulation model is now being used to compute and monitor carbon fluxes along the U.S. eastern continental shelf. Seasonal, interannual and spatial variability in the carbon budget is considerable (Fig. 8). Initial results indicate that presently this region acts as a sink of atmospheric CO2 of roughly 8.5 TgC/year (Fig. 9). Offshore transport of POC and DOC are each roughly 10 times greater than burial on the shelf. Fig. 2 : DLEM-estimated changes of DOC (left), DIC (center), and POC (right) and leaching in watersheds draining to the U.S. east coast. Dynamic Land Ecosystem Model (DLEM) simulations suggest that total carbon (TC, including DOC, POC and DIC) of about 6.9 ± 0.6 TgC yr-1 (1 Tg = 1012 g) has been exported to the Mid Atlantic Bight (MAB), Georges Bank (GB), and Gulf of Mexico coastal margins. Exported TOC increased by 11% from the 1950s to 2008. The export of total nitrogen (TN) to MAB has significant inter-annual and decadal fluctuations in the past hundred years as estimated by DLEM, which is mainly caused by increasing fertilization and nitrogen deposition. DLEM also provides information about the spatial and temporal patterns of carbon leaching from land to river networks (Fig. 2). Fig. 5: Summer anomalies of primary productivity (PP) and air-sea CO2 flux [units of gC/m2/y] generated by doubling nutrients (Nx2) and freshwater (FWx2) . References: Druon et al., 2010. Modeling the dynamics and export of dissolved organic matter in the northeastern U.S. continental shelf. Estuarine, Coastal and Shelf Science, 88, 488-507. Fennel et al., 2008. Denitrification effects on air-sea CO2 flux in the coastal ocean: Simulations for the northwest North Atlantic, GRL, 35, L24608. Hofmann et al., 2008. Eastern U.S. continental shelf carbon budget: integrating models, data assimilation, and analysis. Oceanog., 21(1), 86-104. Hofmann et al., 2011. Modeling the dynamics of continental shelf carbon. Annual Review of Marine Science, 3, 93-122. Pan et al., 2011. Remote sensing of phytoplankton community composition along the northeast coast of the United States. Remote Sensing of Environment, in press. Fig. 9: NENA model budgets averaged over the 2004-2007 time period for total carbon (left), inorganic carbon (middle) and organic carbon (right) for coastal waters of the eastern U.S. “HorAdv + Diff” represents the cross-shelf flux.