Download
1 / 47
480 likes | 486 Views
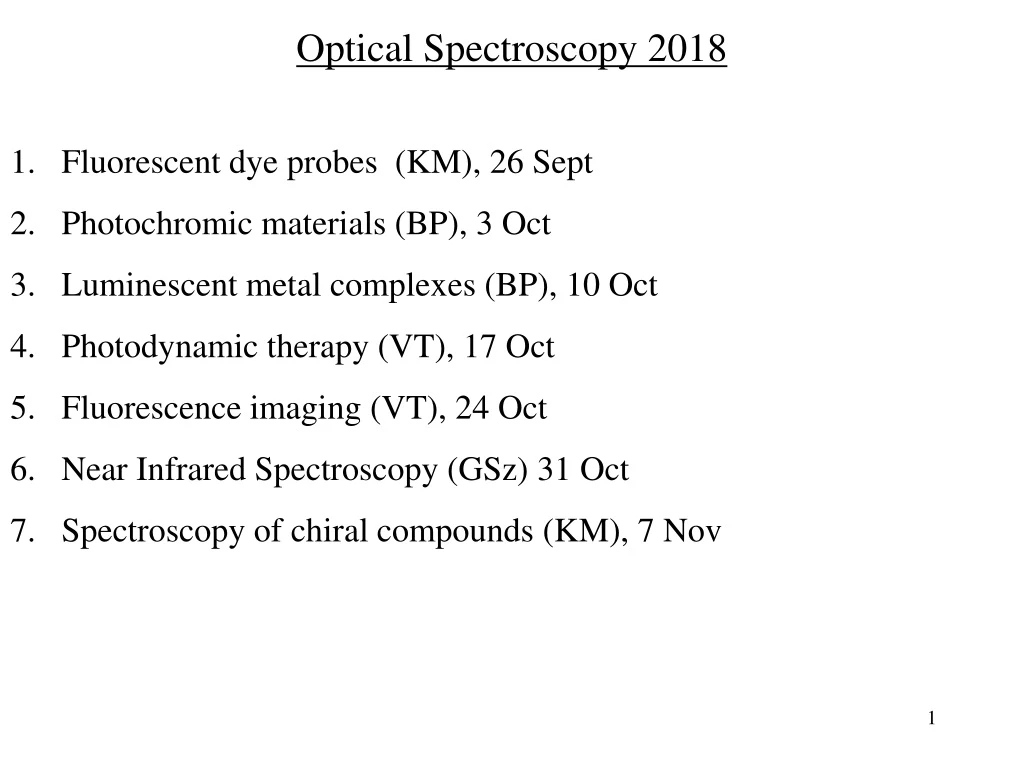
Optical Spectroscopy 2018 Fluorescent dye probes (KM), 26 Sept Photochromic materials (BP), 3 Oct Luminescent metal complexes (BP), 10 Oct Photodynamic therapy (VT ), 17 Oct Fluorescence imaging (VT), 24 Oct Near Infrared Spectroscopy ( GSz ) 31 Oct

E N D
OpticalSpectroscopy 2018 • Fluorescentdyeprobes(KM), 26 Sept • Photochromicmaterials(BP), 3 Oct • Luminescent metal complexes(BP), 10 Oct • Photodynamictherapy (VT), 17 Oct • Fluorescenceimaging(VT), 24 Oct • NearInfraredSpectroscopy (GSz) 31 Oct • Spectroscopy of chiralcompounds(KM), 7 Nov
ALAPISMERETEK(vizsgára, doktori szigorlatra átismételni) Kémiai anyagszerkezettan V. OPTIKAI SPEKTROSZKÓPIA (Optsp05) VI. A MOLEKULÁK FORGÓMOZGÁSA (Forgo05) VII. A MOLEKULÁK REZGŐMOZGÁSA (Rezgo05) VIII. A MOLEKULÁK ELEKTRONSZERKEZETE (Molel05) X. LÉZEREK, LÉZERSPEKTROSZKÓPIAI MÓDSZEREK (Lezer05)
Nobel prize in Chemistry 2008 GFP = Green Fluorescent Protein Martin Chalfie Osamu Simamura Roger Y. Tsien
Nobel prize in Chemistry 2014 STED = Stimulated Emission Depletion Eric Betzig William E. Moerner Stefan W. Hell
Advantages of detection of fluorescence over detection of absorbtion 1. Sample may be non-transparent 2. Higher sensitivity 3. Triple selectivity - excitation wavelength - emission wavelength - delay time Disadvantage: only a few type compounds are fluorescent
Fluoreszcent dye probesFunction: provide information on local environment J. R. LAKOWICZ, Principles of Fluorescence Spectroscopy, 2nd Edition, Kluwer Academic, London, 1999
Main points • Instruments • stationaryfluorescencespectrometer • time-correlatedsinglephotoncounting • Molecularchemosensors: detection of ions, molecules • Polaritysensors • Viscositysensors • Fluorescence of proteins / triptophan • Distancemeasurement : FRET
Spectrofluorimeters • stationary • time-resolved (measures F, time-correlated single photon counting)
Excitation and emission flurescence spectra Excitation sp: similar to absorption sp, bands of S0 →S1, S0 →S2, ∙∙∙ transitions Emission sp: only S1 →S0, IF is relative, depends on instrument! a.u.!
Fluorescence quantum yield Determination of F - integrating sphere - standard X: sample R: standard IX,IR integrated intensities of fluorescence bands AX, ARabsorbances at excitation wavelength nX, nRindeces of refraction
Chemosensors: fluorescent detection of non-fluorescent ions, molecules
Chemosensor for fluorescent detection of Na+ ions CoroNa Green
Chemosensor for fluorescent detection of Na+ ions Distribution of Na+ ions eloszlása neurons, Microscopic image with application of CoroNa Green W. J. Tyler et al. , PlosOne 3, e3511 (2008)
Chemosensor for fluorescent detection of Cl- ions MQAE Selective: nitrate, phosphate – no quenching, Br-, I- quenching Its operation is based on dynamic quenching
Chemosensor for fluorescent detection of Cl- ions Distribution of Cl- ions in neurons IF image FLIM: fluorescence lifetime imaging
Dynamic quenching: Stern-Volmer equation M + h M + h M + M* M + Q
Deactivation rates and fluorescence quantum yields in the absence and presence of quencher No quencher With quencher
Polarity sensors Nile red water, - methanol - ethanol - acetonitrile -dimethylformamide, 6. acetone -ethyl acetate - dichloromethane - n-hexane - methyl-tert-butylether - cyclohexane - toluene.
Confocal image of the algae stained by Nile red The accumulation of oil droplets (golden dots). Red represents chlorophyll autofluorescence. phys.org
„charge transfer (CT)” dyes S1 S0 solvent polarity
- - - - + G v. E _ + + + + 2a Effect of polarity on spectra: Lippert equation
Lippert equation - - - - + G v. E _ + + + + 2a
Stokes shifts of naphthalane derivatives ethanol-water solvent mixtures Lakowicz, p. 191
Orientation relaxation of dye solutes(rotational diffusion) Stokes-Einstein-Debye equation f shape factor (spheres f = 1) C friction factor (0<C<1) • local viscosity VM molecular volume T temperaturet k Boltzmann constant
Fluorescence of nile blue on ion exchange resin Habuchi et al., (Sapporo), Anal. Chem. 73, 366-372 (2001) Resin: styrene – divinylbenzene copolymer Cross-linking frequency (): 8 % divinylbenzene Ionexchange group: Na-sulphonate
Determination of or : via measuring fluorescence depolarization
Fluorescence of nileblue adsorbedon ion exchangeresin
Dual fluorescence: twisted intramoleculat charge transfer = TICT Fluoresc. spectrum of DMANCN in ethyleneglycol, the ratio of the intensities of the two bands varies with viscosity Lakowicz, p. 201
Fluorescent amino acids phenyl alanine tyrosine triptophane
Absorption and fluorescence spectra of triptophane (water, pH 7) Lakowicz, p. 446
Fluorescence spectra of tryptophane in different local environments • Apoazurin Pfl • T1 ribonuclease • staphillococcus nuclease • glucagon Lakowicz p. 453
Resonance energy transfer (Förster resonance energy transfer = FRET) Molecular ruler to measure distances! Resolution of optical microscope: max. ~ 200 nm, depends on FRET: detection of 2-10 nm distances
Donor dye – acceptor dye, fluorescence band of D overlaps with absorption band of A
If D and A are close, FRET, exciting D, the energy is transferred to A, fluorescence of A is detectable The FRET effect is proportional to 1/r6
Example for application of FRET: study of DNA –phospholipid interaction C. Madeira, Biophys. J. 85, 3106 (2003)
Acceptor Donor: EtBr (ethidium bromide)
BODIPY fluorescence EtBr absorption