Download
1 / 16
160 likes | 297 Views
OECD’s Trade Indicators Project (TIP). Agenda Item 10b. Methodological improvements and extended coverage. Introduction.

E N D
OECD’s Trade IndicatorsProject (TIP) Agenda Item 10b Methodological improvements and extended coverage
Introduction • After the recent technical improvements, OECD’s multidimensional Trade Indicators database has gained more and more popularity amongst users searching for more analytical statistics, in particular within the context of globalisation analysis. • Methodological consistency for calculating indicators, as well as the innovative interactive Web-based query tool, presented at the last ITS Expert Meeting in September 2006, can be considered as strong points of TIP. • Since the last meeting, TIP has been further evolving: new indicators were added and new features, the radar charts, complete the already popular country profiles. The TIP is by now not only a well-established and popular statistical product, but also a unique working tool of OECD’s Statistics Directorate.
Introduction • The TIP database consists of several sub-datasets which have been merged under the header of Trade Indicators. While the “Macro Trade Indicators” cover a broader and more general view showing economic basis indicators typically without a sectoral breakdown, the “Micro Trade Indicators” allow an analysis at detailed commodity and activity level in different classifications. The last addition to the Micro Trade Indicators consisted in a breakdown by ICT Groups. • The Internet site of the Trade Indicators has been improved and updated; a user-friendly URL has been created. Links to the diverse TIP datasets within OECD.STAT can be found on the site, as well as the country profiles for download. The TIP dataset has been moved towards the ‘globalisation theme’ (OECD.STAT).
Introduction • The denominator of several indicators has been changed from OECD total to world total to take into account the increasing importance of countries outside OECD. This concerns especially the RCA and export performance indicators. However, this was not possible for all indicators due to missing world totals or missing coherent world totals in some cases. The metadata within OECD.STAT have been adjusted accordingly. • To get a more pertinent picture of the development of individual OECD member countries in relation to the OECD average (or in relation to another OECD member country), a new interactive graphic module, based on radar charts, has been provided and been made available for download on the TIP website.
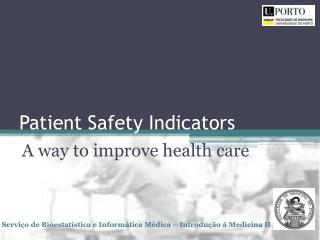
SITC2 (00-97) new ICTGroup (I-V) SITC2 (00-97) SITC2 (00-97) ICTGroup (I-V) IND5: Herf. Index (geo concentr.) SITC2 (00-97) HS2 (00-99) HS2 (00-99) Time (1961-2005) HS2 (00-99) SITC2 (00-97) IND1: Revealed comparative advantage IND1: Revealed comparative advantage IND1: Revealed comparative advantage IND4: Export performance IND2: Worldmarket share IND2: World market share IND4: Export performance IND2: Worldmarket share Time (1996-2005) Time (1988-2005) Time (1961-2005) Time (1996-2005) Time (1961-2005) Time (1988-2005) Time (1961-2005) Time (1988-2005) IND3: Trade balance (goods) Micro Trade Indicators by SITC Time (1961-2005) new Country (30) Country (30) Country (30) Country (30) Country (30) Country (30) Country (30) ICTGroup (I-V) HS2 (00-99) new HS2 (00-99) IND5: Herf. Index (geo concentr.) IND5: Herf. Index (geo concentr.) Time (1961-2005) Time (1988-2005) Micro Trade Indicators by HS IND3: Trade balance (goods) Time (1988-2005) new Country (30) Country (30) Country (30) Country (30) new ISIC (01-98) ISIC (01-98) ISIC (01-98) ISIC (01-98) ISIC (01-98) Micro Trade Indicators by ISIC IND5: Herf. Index (geo concentr.) Time (1961-2004) IND1: Revealed comparative advantage IND3: Trade balance (goods) IND2: OECD market share IND4: Export performance Time (1988-2004) Time (1961-2004) Time (1988-2004) Time (1961-2004) Country (30) Country (30) Country (30) Country (30) Country (30) EBOPS(205-291) EBOPS(205-291) Micro Trade Indicators by EBOPS IND2: OECD market share IND1: Revealed comparative advantage Time (1988-2004) Time (1988-2004) Country (30) Country (30) ICTGroup (I-V) ICTGroup (I-V) new new new new new soon IND3: Trade balance (goods) IND4: Export performance Time (1996-2005) Time (1996-2005) Micro Trade Indicators by ICT Group Country (30) Country (30) Country (30) Country (30)
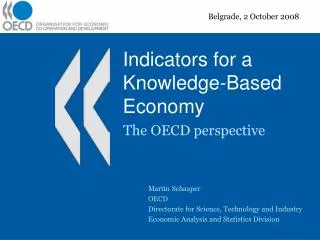
Progress made since the 7h ITS meeting in September 2006 • Micro Trade Indicators by ICT Groups • Information and communication technologies (ICT) have been at the heart of economic changes for more than a decade. ICT-producing sectors play an important role, notably by contributing to rapid technological progress and productivity growth. ICT sector contributions are significant and generally growing throughout OECD and also outside. In recognition of the also growing trade of ICT goods amongst countries, the Secretariat has taken the necessary steps to consistently add them to the battery of trade indicators. • The recent analytical extension by ICT groups of the ICTS database allowed setting-up the new TIP dataset ‘Micro Trade Indicators by ICT Group’.
x 47 x 3 x 4 Progress made since the 7h ITS meeting in September 2006 Degree of export specialisation (RCA) by ICT Groups
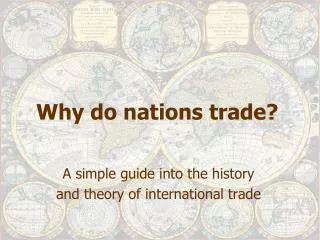
Progress made since the 7h ITS meeting in September 2006 b)From OECD perspective to world perspective • For the Micro Trade Indicators by SITC, HS and ICT Groups, the indicators ‘Market share’, ‘RCA’ and ‘export performance’ have been recalculated and refer to world totals now (instead of OECD totals, as before). This improves the significance of the respective indicators because the OECD share in the world total has decreased. Total merchandise trade, comprising both OECD and non-OECD aggregates and countries world-wide, is now the perspective. c) New concentration indicator on micro level: Herfindahl • A new indicator (within the micro trade indicators), the Herfindahl index, has been added to measure the geographic concentration of the merchandise exports. This indicator has been calculated for the SITC-, HS- and ISIC-classifications and will be added for the ICT-Groups soon.
Herfindahl Index (geographic concentration) for SITC 7: Machinery and transport equipment (exports) Mexico‘s and Canada‘s exports are most-concentrated in terms of partner countries for this SITC chapter Sweden and Turkey have the lowest geographical Concentration for exports of SITC 7 STD/PASS/TAGS – Trade and Globalisation Statistics
Progress made since the 7h ITS meeting in September 2006 d) New ways of interactive graphic presentation • An additional graphical approach, in the form of interactive radar charts, has been made available for download on the Trade Indicators website. This chart (in xls-format) allows comparing the situation of one selected OECD country (for a selection of trade indicators, both macro and micro indicators) to the OECD average or another OECD country. In other words, the radar chart uses indexes of the indicators to enable a more distinctive look at where a country stands within the OECD.
Directions for further research • The TIP has reached maturity. Future work and related improvements fall into two categories: first, technical, IT-driven developments which permit a better understanding of complex patterns and more immediate access to the key messages of underlying information. The second category concerns substance, that is new or better indicators. Both categories are important. • The development and extension of advanced visualisation options is still one of the key aspects for further work under the first category of the trade indicators. A good graphic presentation is an important element for international indicators. Though there are already country profile charts and interactive radar charts available now, these options do not yet represent the best solution in terms of graphics interface. Further developments in this domain will very probably depend on the future graphic software product which will be chosen for the whole OECD and the level of IT support for TIP. Investigations and feasibility studies are underway.
Directions for further research[‘ctd] • Concerning substance, the inclusion of more and more trade in services data (detailed data by products and partner countries) continues to be an important development objective. Trade in services is already included in the macro trade indicators, but needs to be further developed for the expansion of the micro trade indicators for services. • As could be shown, the current TIP indicators dataset is not a static one. The indicators will remain a pro-active and flexible tool for economic and policy analysis. Depending on resources and related maintenance costs more indicators should and will be added (the so-called “trade plus” indicators). • Following a corporate management decision at OECD, the TIP dataset has been moved to the Globalisation Theme of OECD.Stat, the OECD data warehouse. This was in recognition of its very nature, namely key trade indicators as part of the broader globalisation process.
Directions for further research[‘ctd] • Amongst the avenues to be included for possible further extension (or separate addition under “Globalisation”) are: • Links of customs sources with enterprise structural statistics, into trade indicators with the objective to develop new databases where trading is matched to enterprise characteristics, such as employment size classes, sector and partner country (see agenda item 8). • Trade statistics by type of ownership of the enterprise, concentration of foreign trade by enterprises, impact of international groups of enterprises on trade statistics, and the like. Duplication with existing databases is to be avoided. • New Trade Indicators to be added: the work on new trade and globalisation indicators will be largely guided by the internal OECD Reflection Group on Globalisation Statistics. To ensure consistency with other international bodies, OECD invites selected International Organisations to be part of a Trade Indicators Development Group, convened by OECD. • The role of re-imports and re-exports, inward and outward processing of goods in international trading.
Going beyond traditional statistical standard classifications:ICT - Information and communication technology Delegates are invited to: • Comment on the TIP developments shown. • Provide guidance to the Secretariat as to which areas – as mentioned before - should be pursued as a priority and integrated into TIP. This would imply indicating negative priorities as well. • Share similar national approaches, priorities and challenges with trade experts present. • Indicate whether they could contribute to TIP in areas of relevance, but not covered at present, and would be ready to work with OECD.