Download
1 / 39
390 likes | 492 Views
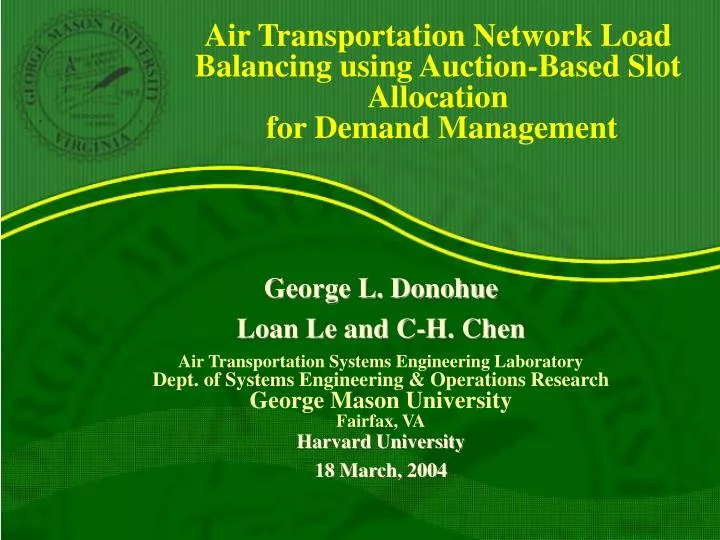
Air Transportation Network Load Balancing using Auction-Based Slot Allocation for Demand Management. George L. Donohue Loan Le and C-H. Chen Air Transportation Systems Engineering Laboratory Dept. of Systems Engineering & Operations Research George Mason University Fairfax, VA

E N D
Air Transportation Network Load Balancing using Auction-Based Slot Allocation for Demand Management George L. Donohue Loan Le and C-H. Chen Air Transportation Systems Engineering Laboratory Dept. of Systems Engineering & Operations Research George Mason University Fairfax, VA Harvard University 18 March, 2004
Outline • Necessity of Demand Management • History of US Demand Management • Auction model for airport arrival slots • auctioneer optimization model • airline optimization model • Atlanta airport case study • simulated scenarios • results and interpretation • Observations
Why Demand Management? • Over-scheduling causes delay and potentially compromises safety Atlanta Airport - FAA Airport Capacity Benchmark 2001
Data Indicates Loss of Separation Increases at High Capacity Fraction • Over-scheduling causes accident pre-cursor events and potentially compromises safety Statistics at ATL, BWI, DCA and LGA airports (Haynie)
Observed WV Separation Violations vs. Capacity Ratio Haynie, GMU 2002
Flight Banking at Fortress Hubs Creates Inefficient Runway Utilization • Over-scheduling causes accident pre-cursor events and potentially compromises safety • Under-scheduling wastes runway capacity Atlanta Airport - FAA Airport Capacity Benchmark 2001
Enplanement Capacity is More Important than Operational Capacity • Small aircraft make inefficient use of runway capacity ATL total operations (OAG Summer 2000) Cumulative seat share seats/aircraft Cumulative flight share Cumulative Seat Share vs. Cumulative Flight Share and Aircraft Size
Excess Market Concentration May Lead to Inefficient Use of Scare Resources HHI is a Metric used to Measure Market Concentration • Hirschman-Herfindahl Index (HHI) is standard measure of market concentration • Department of Justice uses to measure the competition within a market place • HHI=(100*si)2 with si is market share of airline i • Ranging between 100 (perfect competitiveness) and 10000 (perfect monopoly) • In a market place with an index over 1800, the market begins to demonstrate a lack of competition
History of US Demand Management Slot ownership AIR-21 • End of HDR. • What’s next? Deregulation Lottery Apr 2000 Jan 2001 1978 1985 2007 • Use-it-or-lose-it rule based on 80% usage • Exempted from HDR certain flights to address competition and small market access • Cap of the #exemption slots -Congestion pricing? -Auction? LGA Airport Slot Control High-Density-Rule 1968 - Limited #IFR slots during specific time periods - Negotiation-based allocation
Demand Management Approaches • Administrative • negotiation-based IATA biannual conferences • Economic • weight-based landing fee: no incentive for large aircraft – inefficient Enplanement capacity • time-based congestion pricing: not reveal the true value of scarce resources • DoT supervised Market-based Auctions of Arrival Metering-Fix Time Slots • Hybrid
Auction Model Design Issues • Feasibility • package slot allocation for arrival and/or departure slots • politically acceptable prices • Optimality • efficiency: throughput (enplanement opportunity) and delay • regulatory standards: safety, flight priorities • equity: • stability in schedule • airlines’ need to leverage investments • airlines’ competitiveness : new-entrants vs. incumbents • Flexibility • primary market at strategic level • secondary market at tactical level
Design Approach • Objective: • Obtain Better Utilization of Nation’s Airport Network Infrastructure – Network Load Balancing • Provide an Optimum Fleet Mix at Safe Arrival Capacity • Ensure Fair Market Access Opportunity • Increase Schedule Predictability - reduced queuing delays • Assumptions • Airlines will make optimum use of slots they license • Auction rules:Bidders are ranked using a linear combination of: • monetary offer (combination of A/C equipage credit and cash) • flight OD pair (e.g. international agreements, etc.) • throughput (aircraft size) ? • airline’s prior investment ? • on-time performance ?
Strategic Auction Analytical Approach Schedules Auction Model Network Model Bids Slots Airlines Auctioneers NAS Analysis & Feedback • Auctions only at Capacitated Airports • Auction Licenses good for 5 to 10 years
Auction Model Process Determine factor weights, initial bids and increments Simultaneous bidding of 15-min intervals More bids than capacity No End auction process Yes Submit information and bids Call for bids Sort the bids in decreasing ranks Local optimum fleet mix order: smalllarge 757heavy Sequence flights for each intervals Auctioneer’s action Airline’s action
Auctioneer Model money #seats … Bid vector Pj= 1 if Pj wins a round X= (x1 … xj … xn)T xj= 0 otherwise LP : max z = CTX s.t. (ARR·X)i, (DEP·X)i lies within the Pareto frontier i airlines’ combinatorial constraints ARR Weight vector W = (w1 w2)T Rank of a bid vector : W·Pj C = (WT·P1 … WT·Pj … WT·Pn)T DEP
Atlanta’s VMC Auction Model ATL’s VMC capacity (April 2000) 100,100 arrival per hour departure per hour Capacity constraints for 15-min bins: (ARR·X)i 25 (DEP·X)i 25 Let: ARR DEP 25 25 A = , b = maxz = CTX s.t. AX b airlines combinatorial constraints
Airline Bidding Model B 2,4 1,3 C 1,5 F 2,6 A E 4,8 3,7 D Bidding is all about scheduling • Determine markets, legs, frequencies and departure times • Fleet assignment : • (aircraft type,leg) • line-of-flying (LOF): sequence of legs to be flown by an aircraft in the course of its day
Simple Flight Schedule Example Bidding is all about scheduling • Determine markets, legs, frequencies and departure times • Fleet assignment : • (aircraft type,leg) • line-of-flying (LOF): sequence of legs to be flown by an aircraft in the course of its day Daily arrivals and departures at A of one LOF: B time 2,4 1,3 C 1,5 ARR F 1 2,6 1 A 1 DEP E 4,8 3,7 1 1 D 1 simple package bidding
Schedule Banking Constraints Bidding is all about scheduling • Determine markets, legs, frequencies and departure times • Fleet assignment : • (aircraft type,leg) • line-of-flying (LOF): sequence of legs to be flown by an aircraft in the course of its day Daily arrivals and departures at A of one LOF: B time 2,4 1,3 C 1,5 ARR F 1 2,6 1 A 1 DEP E 4,8 3,7 1 1 D 1 complex package bidding
Assume the Airlines have a Near Optimal Schedule and Try to Maintain in Auction • Airlines’ elasticity for changing schedule 15min 15min bids withdrawn bids withdrawn original scheduled 15-min interval • Airlines bid reasonably and homogeneously by setting an upper bid threshold proportional to #seats (revenue) • No fleet mix change
Airline Agent Tries to Maximize Profit Subject to: Objective function: Maximize revenue and ultimately maximize profit Maximise To bid or not to bid Upper bound for bids Lower bound for bids Variables: {Bs} set of monetary bids {Ps} airline expected profit by using a slot M big positive value ys binary value BoT airport threshold vector airline threshold fraction Bs’ old bid for slot s in previous round if airline bids for slot s otherwise • Airlines’ package bidding constraints
Network Model used to Evaluate Auction Effectiveness 11-node network MSP LGA DTW ORD DEN BWI SFO IAD LAX PHX ATL DFW • Runway capacity determined by • Wake Vortex Separation Standards (nmiles/seconds) (M. Hanson) departure separation arrival separation • and a scale factor to account for runway dependency
Simulation scenarios • Assumptions: • Aircraft can arrive within allocated slots with Required Time-of-Arrival errors of 20 seconds (using Aircraft RTA Capabilities) • Auction items: Metering Fix Arrival Slots • No combinatorial package bidding • Bid values and minimum increments are relative to the value of initial bid • Input: • Summer 2000 OAG schedule of arrivals to ATL (1160 flights) • Scenario 1 (Baseline): • OAG schedule • Scenario 2 (Simple auction): • Monetary Offer is the only determining factor • Auction-produced schedule
Traffic levels and estimated queuing delays during VMC Scheduled arrivals (#operations/quarter hour) ATL reported optimum rate Estimated Average Runway Queuing Delay (min) 45 min maximum schedule deviation allowed, no flights are rerouted
Results : Flight Deviations ~70% min 15-min max allowed 30-min max allowed 45-min max allowed • Bell-shaped curves are consistent to the model assumption about airline bidding behavior • Curves are skewed to the right due to optimum sequencing that shifts aircraft toward the end of 15-min intervals
Results : Auction metrics #Flights to be rerouted Average cancelled arrivals in summer 2000: 23 23 #Seats to be rerouted #Rounds Average Auction Revenue Per Flight (x $Initial Bid) #seats of rerouted flights Maximum schedule deviation allowed (min)
Observations on Research to Date • Simple Auctions could Exclude small airlines and/or small markets from Hub Airports • Simple Bidding Rules can Prevent this Problem • Number of flights to be rerouted is comparable to the number of cancelled flights • Combinatorial Clock Auctions Offer a Promising Market-Based approach to Demand Management • Auction Proceeds could be used as Incentives to the Airports for Infrastructure Investments and to the Airlines for Avionics Investments
Airlines Could bid with Avionics Investment Promissory Notes • Increased Hub airport capacity is Dependent on Aircraft being able to maintain Accurate Time-Based Separation (ROT and WV safety constraints) • Data Links, ADS-B, FMS-RTA and New Operational Procedures will be required • Airlines could Bid with Script that constituted a contract to equip their Aircraft with-in X years (i.e. ½ bid price) • Cash Bids could be used to replace PFC’s and go directly to the Capacitated Airport’s Infrastructure Investment Accounts
Future work • More airline and airport inputs • Experimental auction Participation • Include Efficiency Rules • Include combinatorial bidding • Include pricing • Conduct experimental auctions
Observed Runway Incursions One formal simultaneous runway occupancy -14 sec Several “near” simultaneous runway occupancies Out of 364 valid data points
LGA Arrival Histograms Normalized by Arrival RateDisplaying Positive or Negative Deviation from WVSS Adherence Perfect WVSS Adherence = 0
ATL Arrival Histograms RW 27 Normalized by Arrival RateDisplaying Positive or Negative Deviation from WVSS Adherence Perfect WVSS Adherence Value = 0
ATL Arrival Histograms RW 26 Normalized by Arrival RateDisplaying Positive or Negative Deviation from WVSS Adherence Perfect WVSS Adherence Value = 0
Aircraft Wake Vortex Separation Violations : LGA & BWI Perfect WVSS Adherence Value = 0
FAA Barriers to Change • FAA has an Operational and Regulatory Culture • Inclination to follow training that has seemed to be Safe in the Past • FAR has NOT Changed to Provide Operational Benefits from Introduction of New Technology • Assumption that Aircraft Equipage would be Benefits Driven did not account for Lack of an ECONOMIC and/or SAFETY Bootstrapping Requirement
FAA Investment Analysis Primarily focus on Capacity and Delay • OMB requirement to have a B/C ratio > 1 leads to a modernization emphasis on Decreasing Delay • In an Asynchronous Transportation Network operating near it’s capacity margin, Delay is Inevitable • Delay Costs Airlines Money and is an Annoyance to Passengers BUT • is Usually Politically and Socially Acceptable
Hypothesis: Most Major Changes to the NAS have been due to Safety Concerns • 1960’s Mandated Introduction of Radar Separation • 1970’s Decrease in Oceanic Separation Standards Required a Landmark Safety Analysis • 1970’s Required A/C Transponder Equipage • 1970’s Required A/C Ground Proximity Equipage • 1990’s Required A/C TCAS Equipage • 1990’s Required A/C Enhanced Ground Prox. Equipage • 1990’s TDWR & ITWS Introduction • 1990’s Mandated Development of GPS/WAAS