Download

1 / 39
390 likes | 478 Views
Chapter 5 Appendix Indifference Curves . Problem 1.

E N D
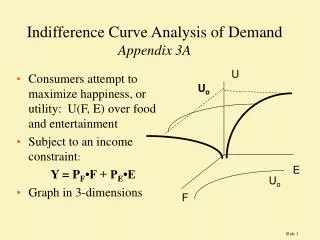
Problem 1 • Suppose a consumer’s income is M=$1,200 per month, all of which he spends on some combination of rent and restaurant meals. If restaurant meals cost $12 each and if the monthly rent for an apartment is $3 per square foot, draw this consumer’s budget constraint, with his monthly quantities of restaurant meals per month on the vertical axis and apartment size on the horizontal axis. Is the bundle (300 square feet/month, 50 meals/month) affordable?
Solution to Problem 1 • If she spends all of her income on meal, , the vertical intercept of the consumer’s budget constraint is 100 meals/month • If she spends all of her income on rent, the horizontal intercept of his budget constraint is 400square feet/month • Bundle A: • 50 meals/month, costs $600/month • 300 square feet/month, costs $900/month • Thus, total income requires is $1,500/month Bundle A lies beyond the budget constraint, and is hence unaffordable
Problem 2 • Show what happens to the budget constraint in problem 1 if the price of restaurant meals falls to $8. Is the bundle (300, 50) affordable?
Solution to Problem 2 • Price of meals falls to $8 • If she spends all of her income on meal, the vertical intercept of his budget constraint is 150 meals/month • If she spends all of her income on rent, the horizontal intercept of his budget constraint is 400square feel/month • Bundle A: • 50 meals/month, costs $400/month • 300 square feet/month, costs $900/month • Thus, total income requires is $1,300/month 100 Bundle A lies beyond the budget constraint, and is hence unaffordable
Problem 3 • What happens to the budget constraint in problem 2 if the monthly rent for apartments falls to $2 per square foot? Is the bundle (300, 50) affordable?
Solution to Problem 3 • Price of monthly rent falls to $2 • If she spends all of her income on meal, the vertical intercept of his budget constraint is 150 meals/month • If she spends all of her income on rent, the horizontal intercept of his budget constraint is 600square feel/month • Bundle A: • 50 meals/month, costs $400/month • 300 square feet/month, costs $600/month • Thus, total income requires is $1,000/month B C 400 Bundle A lies within the budget constraint, and is hence affordable
Problem 4 • When inflation happens, prices and incomes generally rise at about the same rate each year. What happens to the budget constraint from problem 1 if the consumer’s income rises by 10 percent and the prices of restaurant meals and apartment rents also rise by 10 percent? Has the consumer been harmed by inflation?
Solution to Problem 4 • Her new income is $1320/month • The price of restaurant meals is $13.20, • If she spends all of her income on meal, the vertical intercept of the consumer’s budget constraint is 100 meals/month, exactly the same as before • The price of monthly rent is $3.3/square foot, • If she spends all of her income on rent, the horizontal intercept of his budget constraint is 400 square feet/month, exactly the same as before. • Since the consumer’s budget constraint has not changed, he is able to buy exactly the same combinations of goods he was able to buy before. • So he has not been harmed by this inflation.
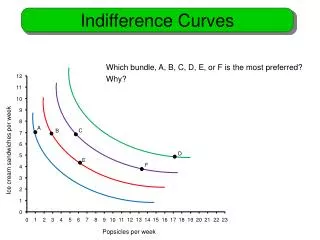
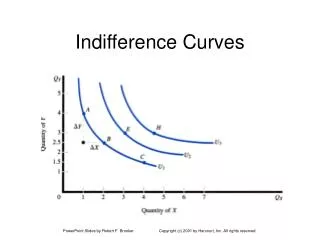
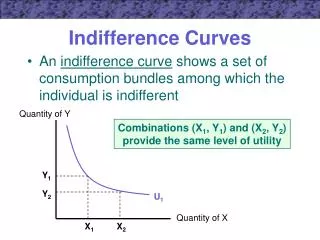
Problem 5 • A consumer spends all his income on two goods, X and Y. Of the labeled points on his indifference map, indicate which ones are affordable and which ones are unaffordable. Indicate how the consumer ranks these bundles, ranging from most preferred to least preferred. Identify the best affordable bundle.
Solution to Problem 5(1) • Affordable bundles: - any bundle that lies on or within the budget constraint - Bundles A, C, D, E, F, G are affordable • Unaffordable bundles: - any bundle that lies beyond the budget constraint - Bundles H and J are unaffordable
Solution to Problem 5(2) • Bundles that lie on the highest indifference curve are the most preferred bundles • Bundles that lie on the same indifference curve are equally preferred • The best affordable bundle should lie on an indifference curve that intersects the budget constraint only once
Solution to Problem 5(3) • To rank these bundles: - H is preferred to J, which is equivalent to G, which is preferred to E, which is equivalent to F, which is preferred to D, which is equivalent to A and C. • The Best affordable bundle is G
Problem 6 • A consumer spends all his income on two goods, X and Y. His income and the prices of X and Y are such that his budget constraint is the line AF. Of the labeled points on his indifference map, indicate which is the best affordable bundle. (Hint: This problem does not have a tangency solution.)
Problem 6(1) • The best affordable bundle should lies on the budget constraint and attains the highest possible indifference curve • Bundle G is unaffordable as it lies outside the budget constraint • Bundle A, C, D, E, F are all affordable as it lies on the budget constraint • The best affordable bundle is F - at this bundle, he attains the highest possible indifference curve (IC5) along his budget constraint • Bundle F is called a “corner solution.”
Problem 6(2) • For a corner solution, - all income will spend on only one good and zero consumption on the other good - utility is maximized at a point where the highest possible indifference curve intersects the budget constraint at zero consumption for Good X and with all income used for Good Y
Additional Question 1 • Jane has $100 to spend. There are only 2 goods for her to choose: compact discs (CDs) and hamburgers. Price of CD = $10. Price of hamburger = $2. • a) Graph Jane’s budget line for compact discs and hamburgers, x-axis for hamburgers and y-axis for compact disc, and use an indifference curve to show on the graph the point that represents a given optimal quantities of compact discs and hamburgers Jane chooses to consume. (Given equilibrium: 5 units of compact discs with 25 units of hamburgers)
(a) Draw Jane’s Budget Line and find the optimal quantities of CDs and hamburgers to be consumed. • What is a Budget Line? • A Budget Line is the ‘Budget Constraint’ of the economic agent. It represents all the different combinations of the 2 goods that Jane can consume when spending all her $100.
How do we draw a Budget Line? • In a simple setting like in this question (no change in price of either goods throughout, no restrictions or special pricing arrangements), the Budget Line is usually a downward sloping straight line. • The X and Y-intercepts represents the amount of CDs or Hamburgers Jane can buy if she spends all her money on only one good.
If Jane is spending all $100 on CDs, and price of a CD is $10, she can at most buy 10 CDs. • Hence, the Y-intercept of Jane’s Budget Line is 10. • Similarly, if she spends all the money only on hamburgers (Price = $2), she can buy 50 hamburgers. • So the x-intercept of the Budget Line is 50. Compact Discs 10 Hamburgers 50
The question also asks us to identify the optimal consumption point by using indifference curves. Given the equilibrium, 5 units compact disc, 25 units of hamburgers. • The optimal consumption point, which is given in this question, is the point at which the Indifference curve is tangential to the Budget Line.
Show what happens to the Budget Line if the Price of CDs drops from $10 to $5. Sketch the new optimal consumption point for Jane. • If the Price of CDs drops, the Y-intercept of the Budget Line rises. • Because if Jane is spending all her $100 just on CDs, she can get 20. • However, the X-intercept of the Budget Line remains unchanged. • Because even if she spends all her money on hamburgers, as the price of hamburgers has not changed, she ends up getting 50. • the Budget Line ‘rotates’ out on the Y-axis.
Compact Discs 20 10 Hamburgers 50
Again, we need to find the optimal consumption point. • The Price of compact discs falls; thus, the Budget Line has changed, Jane may be better off choosing another optimal point to maximise her utility. • The new point is, again, the tangency point of the Budget Line and the (new) Indifference Curve.
TWO effects will be induced in the consumption choice of compact discs. • A change in the price of a good changes - Relative price of the good (substitution effect) and - Overall purchasing power of the consumer (income effect) • Substitution effect: - is observed with changes in relative price of goods When PCD falls, other things being constant ( PHamburger, income), people consume more compact disc and less hamburger.
Applying the Rational Spending Rule: • At the optimal combination of goods, the Rational Spending Rules, MUCD / PCD = MUH / PH • When PCD falls, the MU per dollar of CD rises relative to Hamburger. That is, MUCD / PCD > MUH / PH • To satisfy the Rational Spending Rule, we will increase our consumption of CD and decrease our consumption of Hamburger. • Therefore, the reduction of PCD will not only change (increase) the amount of CD we could afford but also change (decrease) the amount of Hamburger we could afford in combination with any given amount of CD. • The reallocation of our optimal combination due to a change in “relative”prices as described in here, is called the substitution effect.
Income effect: - Decrease in price of a good just like giving consumer a gift, which is rather like an increase in income - is observed through changes in purchasing power • When PCDdrops, purchasing power of the individual increases • Both hamburger and compact discs are assumed to be normal goods in this case • That is, he should buy more CD and hamburger in the new equilibrium (income effect).
Applying Rational Spending Rule: • If we simply switch our consumption from Hamburger to CD until the MU per dollar are the same, we will have some income not spent resulted from the lower price of CD. Thus, we are now richer than before. • We have to allocate this “extra” purchasing power to both good. Thus, we may increase our consumption of both goods. • The allocation of our “additional” purchasing power to the two goods, asdescribed in here, is called the income effect.
As PCD falls, the new optimal consumption point moves from pt. A to pt. B Compact Discs 20 10 B A 5 Hamburgers 25 50
(c) Suppose there is an increase in Jane’s wealth. Jane now has $150 rather than $100. Show the change in diagrams for the cases of CDs being normal and CDs being inferior. • Jane has an increase in wealth. At the same time, prices of CDs and health have not changed. • Therefore, the Budget Line should shift outwards in a parallel manner.
Compact Discs 15 10 75 Hamburgers 50
Here, we should consider only the ‘income effect’. • If CDs are normal goods, income effect on CDs should be positive (the more wealthy/ purchasing power one gets, the more CDs needed) • Note: hamburger is assumed to be normal good in this case as well.
Positive Income Effect on CDs • CDs and Hamburger are normal goods • Consumption of CDs increases • Consumption of Hamburger increases Compact Discs 15 10 B A 75 Hamburgers 50
If CDs are inferior goods, income effect on CDs should be negative. (i.e. higher income, less CDs consumed) • The new consumption point will contain less CDs than the original point. • Note: hamburger is assumed to be normal good in this case as well.
Negative Income Effect on CDs • CDs are inferior goods and Hamburger is a normal good • Consumption of CD decreases • Consumption of Hamburger increases Compact Discs 15 10 A B 75 Hamburgers 50
Additional 2Substitution effect and Income effect True or false (income and substitution effects): In a market with only two goods, say A and B, if the price of good A lowers and other things being equal (income and the price of good B), the consumer will always buy more good A and less good B. (Assume Good A and B are normal goods) Substitution Effect: i.e. When price of a good X increases, substitutes for that good, good Y, become relatively more attractive. Consumers switch to good Y and buy less on good X. Income Effect: Refers to the fact that when price of a good changes, it makes the consumers either poorer or richer in real terms.
True or false (income and substitution effects): In a market with only two goods, say A and B, if the price of good A lowers and other things being equal (income and the price of good B), the consumer will always buy more good A and less good B. (Assume Good A and B are normal goods) Not necessary. -It is true according to Substitute Effect. - It is not true according to Income Effect. You will consume more of both goods if real income increases. - It is true unless Good A is a normal good and Good B is an inferior good.