Download
1 / 5
60 likes | 80 Views
How do we graph linear equations?. Graphing Linear Equations : First, make sure you solve for slope-intercept form (if necessary), y = mx + b Plot your y – intercept (b), then plot three more points using the slope

E N D
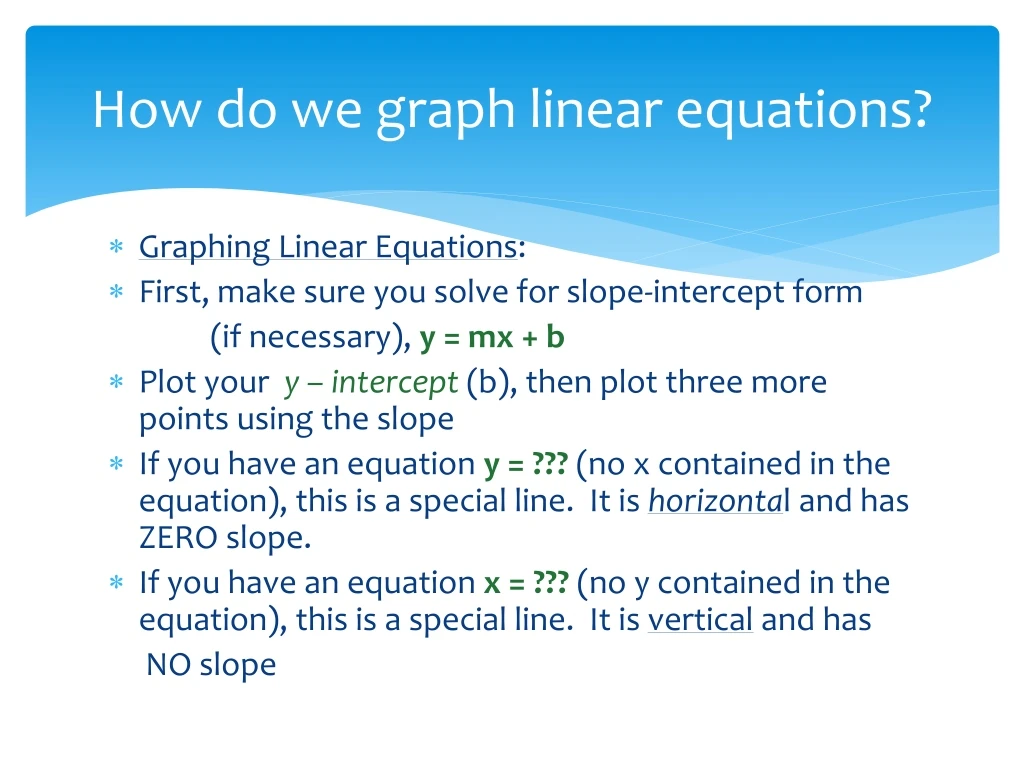
How do we graph linear equations? • Graphing Linear Equations: • First, make sure you solve for slope-intercept form (if necessary), y = mx + b • Plot your y – intercept (b), then plot three more points using the slope • If you have an equation y = ??? (no x contained in the equation), this is a special line. It is horizontal and has ZERO slope. • If you have an equation x = ??? (no y contained in the equation), this is a special line. It is vertical and has NO slope
How do we graph linear equations? a)4x – 2y = 6 b) x = 1 c) 3y = -2x + 6 d) Y = 6
Part 2: How do we graph linear inequalities? • First, make sure you solve for slope-intercept form (if necessary). *Remember that the inequality sign changes direction if you multiply or divide by a negative number!* • Follow same steps for graphing the line as above. • Before you “connect the dots” make sure you determine the following: • If the inequality is > or <, the line is DOTTED • If the inequality is ≥ or ≤, the line is SOLID • If the inequality is < or ≤, the line is shaded BELOW • If the inequality is > or ≥, the line is shaded ABOVE
Part 2: How do we graph linear inequalities? a) 3x < 4 – 2y b) y ≥ -1 c) 5x + 10y > 20 d) X < 5
Summary: Answer in complete sentences. What does a solid line in the graph of an inequality mean? What does a dash line in the graph of an inequality mean? Graph and compare the difference in graphing 3x – 2y > 6 and 3x – 2y = 6.