Download
1 / 13
130 likes | 219 Views
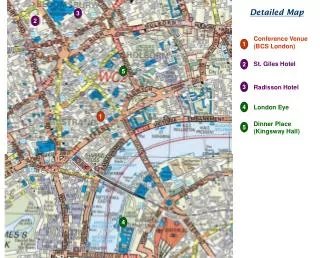
“SMALL TOWNS FOR TOMORROW” Launch Conference Thursday 8 July 2010 The British Academy London. A NEW GEOGRAPHY OF ENGLAND Where do the small towns fit?. Professor Sir Peter Hall Small Towns for Tomorrow Launch Conference British Academy, London Thursday 8 July 2010.

E N D
“SMALL TOWNS FOR TOMORROW” Launch Conference Thursday 8 July 2010 The British Academy London
A NEW GEOGRAPHY OF ENGLANDWhere do the small towns fit? Professor Sir Peter Hall Small Towns for Tomorrow Launch Conference British Academy, London Thursday 8 July 2010
A New Geography of England • Regional split (N/S) remains • Driver: shift manufacturing> knowledge economy • Plus: Geog of consumption • But new splits: • (1) Core Cities v. rest • (2) Core City Cores/Core City remainders/old industrial towns/country towns • Dorling 2007: Diagonal divide?
The Continuing N-S Gap • Regional Futures (Arup 2005) • GVA/head gap persists - because • North poor in private services • North dependent on public services • Maps: Golden Belt versus Rustbelt (“Archipelago Economy”)
The Continuing N-S Gap • State of the Cities 2006 • N-S Split • New firms fewer in N • GVA/head lower, poverty higher • But: Core Cities special • Old industrial towns/resorts at bottom of heap • Getting worse?
Knowledge Jobs Source: Jones et al 2008
Knowledge Jobs Source: Jones et al 2008
Population Projections 2007: Summary • UK population: sharp increase: 60.6m (2006) > 71.1m (2031): +10.5m (+19.1%) • Huge increase on 2004 projection (+6.1m, +10.2%) • 5.6m (53.3% total) natural increase • 4.9m (46.7% total) net migration • Differences within UK: Scotland: +5.0%; Wales: +11.1% Northern Ireland:+14.8% (decline forecast 2004!) • Under 16s +1.24m (+10.8%); Working Age +5.69m (+15.1%); Pensioners +3.58m (+31.6%) • Support ratio down: 3.32 > 2.91
…but a N-S contrast Source: Tony Champion, Unpublished Presentation, 2006