Download
1 / 15
150 likes | 265 Views
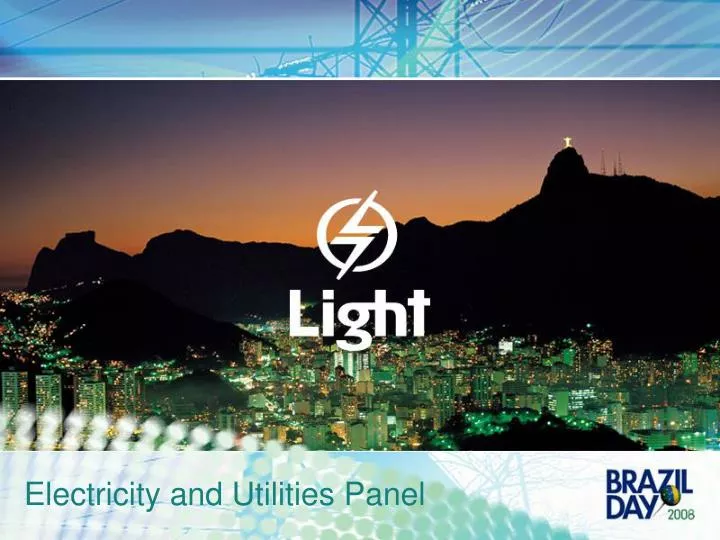
Electricity and Utilities Panel. Brazil Overview. Area: 8.5 million sqm Inhabitants: 188 million 8 th World economy 2007 GDP: US$ 1,500 billion Economy growth 2007: 5.4% 2008-2012 E: 4.0% p.a. 1 Energy consumption growth 2007: 5.8% 2008-2017 E: 5.5% p.a. 2. 1 Source: IBGE

E N D
Brazil Overview Area: 8.5 million sqmInhabitants: 188 million 8th World economy2007 GDP: US$ 1,500 billion Economy growth2007: 5.4%2008-2012 E: 4.0% p.a.1 Energy consumption growth2007: 5.8%2008-2017 E: 5.5% p.a.2 1 Source: IBGE 2 Source: EPE (04/16/2008)
RME - Controlling Shareholders [52.1%] Free Float LUCE Market 25.0% 25.0% 33.6% 6.5% 7.8% 25.0% 25.0% 100.0% NewProjects • Total shares: 203,886,836 • Market Value: R$ 4.4 billions (as of October 16, 2008) Corporate Structure
Strategy Return to shareholders Growth in Generation Business Operational Efficiency Losses Reduction Trading Energy Sustainability
4th largest energydistribution company in Brazil Energy distributed GWh (LTM) 22% 10% 28% 12% Residential 7% 21% Industrial Commercial Others Free Costumers Other Discos Net revenues by segment (LTM) 8% 8% LIGHT Residential 42% 31% Industrial Commercial 11% Others Network Use Distribution • 3.9 million clients (attending over 10 million people) • Energy sales (LTM) - 23,550 GWh • 70% of the consumption of Rio de Janeiro state(Brazil’s 2nd GDP) • Distribution Gross Revenue (LTM) - R$ 7.7 billion
Installed Capacity 855MW HPP Santa Branca 56 MW HPP Ilha dos Pombos 187 MW Lajes Reservatory HPP Fontes Nova 132 MW HPP Pereira Passos 100 MW HPP UsinaSubterrânea Nilo Peçanha 380 MW Light’s generation business Actual capacity 6th largest private company in hydro-generation in Brazil
+ 50% 306 1,283 99 976 9 13 855 Assured Energy 2008 SHP Paracambi 2010* SHPLajes2010* HPPItaocara 2013* Total 2013 New Projects Light’s new generation projects Strategy of growing in generation * Light holds a 51% stake in each project.
Trader (R$ MM) 9.2 million 39.7 million Others (R$ MM) 2.9 million 6.7 million 1H08 1H07 Trading Business Integration with clients The clients portfolio rose from 9 in 2006 to over than 40 in 2008 • Air conditioning system of Santos Dumont Building. • Energy efficiency projects in 33 buildings of Oi telecommunications company. • Sale of 1/3 of the energy from SPH Paracambi. • Long term contracts for the sale of 220 Mwa. • Contracts with Votorantim and other relevant energy consumers.
576 318 2H08 (E) 355 322 277 258 1H08 2005 2006 2007 2008 (E) Investments Main investments - 1H08
12.4% 8.3% 1,077 721 4.1% 528 489 243 518 -150 203 2005 2007 1H07 1H08 1H07 2H07 2007 2006 Dividends Dividend Yield Financial Results Net Income (R$ million) Dividends and Dividend Yield* *Based on the closing price of the previous day to the announcement
3,147 2,540 1,550 1,462 4.1 3.4 1.4 1.1 2005 2006 2007 Jun/08 Net Debt (ex-Braslight) Net Debt/Ebitda Indebtedness Net Debt and Leverage Levels (1) Net Debt = Total Debt (excludes pension fund liabilities) - Cash
Short Term 4% 457 Maturity: 5.3 years 410 Long Term 96% 343 281 151 141 74 57 2008 2009 2010 2011 2012 2013 2014 After 2014 * Principal only CDI/Selic 78% 17.03% US$/Euro 4% 12.90% 12.85% TJLP 18% 12.17% 10.73% 9.42% 7.38% 6.45% Nominal Cost Real Cost Indebtedness Amortization Schedule* Jun08 (R$ million) Debt Cost Evolution
Contact Information Ronnie Vaz MoreiraExecutive Vice-President and IRO Ricardo LevyFinance and IR Superintendent+ 55 21 2211 2814ricardo.levy@light.com.br Cristina GuedesIR Manager+ 55 21 2211 2560cristina.guedes@light.com.br www.light.com.br