Download
1 / 23
280 likes | 471 Views
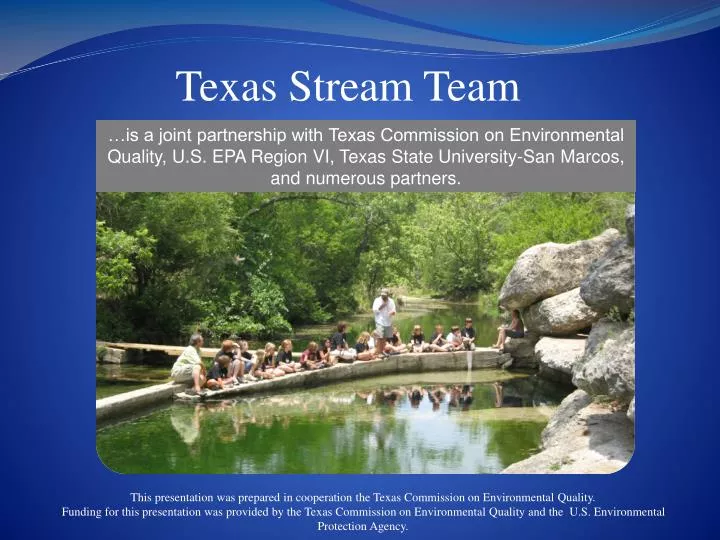
Texas Stream Team. …is a joint partnership with Texas Commission on Environmental Quality, U.S. EPA Region VI, Texas State University-San Marcos, and numerous partners. This presentation was prepared in cooperation the Texas Commission on Environmental Quality.

E N D
Texas Stream Team …is a joint partnership with Texas Commission on Environmental Quality, U.S. EPA Region VI, Texas State University-San Marcos, and numerous partners. This presentation was prepared in cooperation the Texas Commission on Environmental Quality. Funding for this presentation was provided by the Texas Commission on Environmental Quality and the U.S. Environmental Protection Agency.
Texas Stream Team • A non-profit organization which • facilitates a network of trained citizen water quality monitors and supportive partners • provides educational services and resources regarding watersheds and nonpoint source pollution. • Hundreds of Texas Stream Team volunteers collect water quality data on lakes, rivers, streams, wetlands, bays, bayous, and estuaries in Texas.
Why monitor? • Citizen water quality monitors are the front line of defense for Texas’ water bodies. • 191,000 stream miles in Texas are a challenge for regulatory agencies. • Citizen water quality monitors can detect potential water quality impairments before a professional is able to perform routine monitoring. • Data sets collected by citizens may be more comprehensive than that of the professionals. • Data may also be collected for research or educational purposes.
What do I monitor? • Citizen water quality monitors perform tests to determine a water body’s suitability for • Aquatic life • Core water quality monitoring: conductivity, pH, temperature, dissolved oxygen, transparency, depth, and various field observations • Contact Recreation (i.e. swimming, wading, fishing…) • E. coli bacteria monitoring
What happens to the data? • Citizens mail, fax, or e-mail monitoring forms to Texas Stream Team or partner agency monthly. • The data are entered into the Texas Stream Team database. • After roughly a year of data have been collected, Texas Stream Team will write a data report discussing the quality of the water. • Data reports are distributed to the regulatory agencies to assist them at identifying potential problem areas. • Extreme water quality observations such as very high E. coli bacteria readings are communicated to regulatory agencies immediately.
Taking ownership • With a plethora of sites around Texas, Texas Stream Team cannot detect water quality impairments at every site. • It is important that citizen water quality monitors keep track of and analyze their own data. • Monitors should also determine who the local point of contact should be for communicating water quality impairments and explain that they are monitoring prior to a potential problem. • Your point of contact may be a river authority, city, county or state agency depending on the type of problem
A Watershed… …is the area in which water, sediments, and pollutants drain into a common body of water. Everyone lives in a watershed.
Stream Order • All small tributaries drain into a larger body of water if there is enough flow. • Larger bodies of water are more likely to become impaired due to more tributaries potentially contributing pollution.
Point and Nonpoint Source Pollution Point Source: factory pipes and wastewater effluent Nonpoint Source (NPS): dog waste from your back yard or a parking lot dotted with oil from cars.
Point Source vs. Nonpoint Source Pollution • Point Source Pollution • Easy to regulate because the source is known and there is a responsible party • Examples • Wastewater treatment plants • Factories • Mining operations • Nonpoint Source Pollution • Very difficult to regulate because it comes from common activities all over the watershed • Examples • Sediment • Fertilizers • Bacteria • Pesticides • Trash
Things to Remember Safety First: wear gloves and goggles when handling reagents Rinse Twice Rule: rinse everything with the solution or water you are about to use…twice. Then, always remember to rinse the equipment twice with distilled water before putting away. Completely Fill Out Forms: all forms need to be complete to comply with the Federally Approved Quality Assurance Project Plan (QAPP) that ensures the scientific validity of the water quality data collected
Specific Conductivity • The ability of water to conduct electricity • Measured in microSiemens per centimeter (µS/cm) or milliSiemens per centimeter (mS/cm) • An indirect measurement of total dissolved solids • Electricity flows through dissolved material in water, not the water itself. • Indicates the presence of excessive sediment, nutrients, or salt in a water body • Contaminants tend to attach to sediment.
Specific Conductivity • Sources of total dissolved solids • Agricultural runoff (ex. loose soils from tilling) • Urban runoff (ex. dirt pile at construction site) • Discharge from a wastewater treatment plant (high in nutrients) • Effects on a water body • Nutrients – lowering of dissolved oxygen due to excessive vegetation growth • Salt – dehydration of aquatic life and limiting of water absorption into roots of vegetation (in fresh water bodies) • Sediment – Reduced visibility and clogging of gills
Specific Conductivity • 0-800 µS/cm • Suitable for drinking, irrigation, and livestock • 800-2,500 µS/cm • Suitable for drinking but not preferable • Suitable for irrigation but requires special treatment • Suitable for livestock • 2,500 – 10,000 µS/cm • Not suitable for drinking and irrigation of any crops except those which are salt-tolerant • Suitable for some livestock • Above 10,000 µS/cm • Not suitable for drinking, irrigation, or livestock Source: Department of Primary Industries, Victoria, Australia, Measuring the Salinity of Water, Available from http://www.dpi.vic.gov.au
Converting Values • Values read in mS/cm MUST BE CONVERTED to µS/cm when recording on the data sheet. • Move the decimal to the right three places. • 3.4 3400 • 34 34,000
Water Temperature • Measurements above 27oC/80oF to 35oC/95oF can be threatening to aquatic life, depending on the regular temperature. • Low measurements not regulated because temperatures low enough to be threatening are not caused by humans. • Human-caused sources of temperature changes • Powers plants’ effluent after it has been used for cooling • Hydroelectric plants which release warmer or cooler water (depending on the time of year) near the point of release
Water Temperature • On a yearly scale, • When temperature goes up, dissolved oxygen goes down and vice versa. • Colder, more dense water can hold more dissolved oxygen • On a daily scale, • As temperature goes up, dissolved oxygen goes up. • More intense sunlight = more photosynthesis + higher temperatures more O2
pH • Potential hydrogen ions • Measure of acidity or alkalinity • <7 = acidic • 7 = neutral • >7 = alkaline • Recorded in standard units (su) • Doesn’t actually need to be written because pH will never be in another type of unit
pH • Most suitable range for aquatic life = 6.5-9 • Sources of acidic pH • Acid rain – caused by coal power plants & volcanoes • Runoff of acidic soils • Sources of alkaline pH • Decomposition of limestone • Runoff of alkali soils
Dissolved Oxygen • Measured in milligrams per liter (mg/L) • <2 mg/L: Fatal to most species • <3 mg/L: Stressful to most species • >5 mg/L: Sufficient for most species
Dissolved Oxygen • Sources of low dissolved oxygen • High temperatures • Excessive vegetation growth • Blocks out sunlight from subsurface vegetation • Less sunlight less photosynthesis less oxygen • Subsurface vegetation dies • Decomposition consumes oxygen • High groundwater inflow • Groundwater tends to be low in DO due to reduced aeration