Download
1 / 20
200 likes | 343 Views
MIRS F16 Rainfall Rate Overview and Validation. F. Iturbide-Sanchez, K. Garrett, C. Grassotti, W. Chen, and S.-A. Boukabara. Outline. MIRS Rainfall Rate Validation with TRMM Precipitation Radar-Based (TRMM-2B31) Product. a. F16 Rainfall Rate

E N D
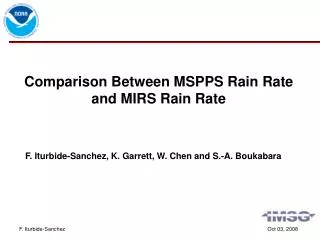
MIRS F16 Rainfall Rate Overview and Validation F. Iturbide-Sanchez, K. Garrett, C. Grassotti, W. Chen, and S.-A. Boukabara
Outline • MIRS Rainfall Rate Validation with TRMM Precipitation Radar-Based (TRMM-2B31) Product. a. F16 Rainfall Rate • MIRS Rainfall Rate Validation with CPC Precipitation. a. Daily Composite Precipitation Estimate b. F16 Daily Precipitation Estimate
F16 Rainfall Rate Compared to N18 Rainfall Rate MIRS F16 Rainfall Rate MIRS N18 Rainfall Rate Same regression algorithm (based on MSPPS) is used to derive F16 and N18 rainfall rate. Main differences are due to the different temporal and spatial coverage.
F16 and N18 Rainfall Rate Compared to TRMM-2B31 Rainfall Rate Over Land 1/2 F16 rainfall rate has shown comparable correlation, bias and standard deviation to N18 rainfall rate when compared to TRMM-2B31 Rainfall Rate over Land. Corr=0.6601 nPts=7447 Bias=-0.0066 Stdv=0.5317 Corr=0.5466 nPts=12774 Bias=-0.0375 Stdv=0.46872 TRMM-2B31 Rainfall Rate (mm/hr) F16 Rainfall Rate (mm/hr) N18 Rainfall Rate (mm/hr) Comparison over Land based on nearly four months of Collocations with TRMM-2B31
F16 and N18 Rainfall Rate Compared to TRMM-2B31 Rainfall Rate Over Land 2/2 F16 and N18 rainfall rate show similar probability distribution of rainfall rate when compared to TRMM-2B31 Rainfall Rate over Land. Binsize=1.0 mm/hr Binsize=1.0 mm/hr F16 Rainfall Rate (mm/hr) N18 Rainfall Rate (mm/hr) Comparison over Land based on nearly four months of Collocations with TRMM-2B31
F16 and N18 Rainfall Rate Compared to TRMM-2B31 Rainfall Rate Over Ocean 1/2 F16 rainfall rate has shown comparable correlation, bias and standard deviation than N18 rainfall rate when compared to TRMM-2B31 Rainfall Rate over Ocean. Corr=0.5896 nPts=23552 Bias=-0.0101 Stdv=0.45084 Corr=0.4099 nPts=34346 Bias=-0.0041 Stdv=0.54404 TRMM-2B31 Rainfall Rate (mm/hr) F16 Rainfall Rate (mm/hr) N18 Rainfall Rate (mm/hr) Comparison over Ocean based on nearly four months of Collocations with TRMM-2B31
Binsize=1.0 mm/hr Binsize=1.0 mm/hr F16 Rainfall Rate (mm/hr) N18 Rainfall Rate (mm/hr) F16 and N18 Rainfall Rate Compared to TRMM-2B31 Rainfall Rate Over Ocean 2/2 F16 and N18 rainfall rate show similar probability distribution of rainfall rate when compared to TRMM-2B31 Rainfall Rate over Ocean. Comparison over Ocean based on nearly four months of Collocations with TRMM-2B31
CPC Gauge-Based AnalysisPrecipitation NOAA Climate Prediction Center (CPC) Gauge-Based Analysis of Global Daily Precipitation represents a unified precipitation product with consistent quantity and improved quality that combines all information sources (state networks, automatic stations, etc.) available at CPC. Number of CPC Gauge Stations CPC Daily Precipitation
Comparison Between Daily CPC Precipitation and Daily Precipitation Estimate from N18 and F16 Over North America 1/2 Precipitation Estimate N18 CPC Precipitation Precipitation Estimate F16
Comparison Between Daily CPC Precipitation and Daily Precipitation Estimate from N18 and F16 Over North America 2/2 MIRS F16 vs CPC Precipitation MIRS N18 vs CPC Precipitation Corr=0.425106 nPts=3893 Bias=0.56842 Stdv=5.86196 Corr=0.522465 nPts=3893 Bias=-2.53102 Stdv=14.6943 F16 Precipitation Estimate shows correlation, bias and standard deviation comparable to N18 Precipitation Estimate relative to CPC Precipitation
Comparison Between MIRS and CPC Daily Precipitation Over North America Correlation between F16 Precipitation Estimate (PE) and CPC Precipitation is comparable to the correlation computed between CPC Precipitation and both N18 PE and MetopA PE. Composite Precipitation Estimate (N18, MetopA and F16) Precipitation Estimate From Single Sensor
Daily Precipitation Estimate From Single and Multiple Sensors (F16, MetopA and N18) MIRS Precipitation Estimate (Composite: N18, MetopA and F16) Precipitation Estimate N18 Precipitation Estimate F16 Precipitation Estimate MetopA
Comparison Between MIRS and CPC Daily Precipitation Over North America Comparisons between MIRS and CPC precipitation are being performed on a daily basis over North America. These comparisons have been performed daily for more than a month. CPC Precipitation MIRS Precipitation Estimate (Composite: N18, MetopA and F16)
Comparison Between MIRS and CPC Daily Precipitation Over North America The F16 rainfall rate improves rainfall detection in the MIRS Composite Precipitation Estimate, without significantly affecting the number of false alarms. Contribution of F16 rainfall rate to MIRS Precipitation Estimate
Comparison Between MIRS and CPC Daily Precipitation Over North America F16 rainfall rate improves the correlation between MIRS Composite Precipitation Estimate and CPC Precipitation.
Conclusions • From comparisons with TRMM-2B31, F16 Rainfall Rate performance over land and ocean is comparable to the N18 Rainfall Rate. • As expected, the F16 Rainfall Rate distribution reproduces the properties of the MSPPS distribution. • Addition of F16 Rainfall improves the probability of detection and correlation coefficient of the MIRS Composite Precipitation Estimate with respect to CPC precipitation. • Validation results of F16 Rainfall Rate, which includes comparison with radar-based (TRMM-2B31), passive microwave-based (N18) and rain gauge (CPC precipitation) observations, have shown that F16 Rainfall Rate is a MIRS product ready for operations over land and ocean surface types. • Finally, as shown in previous presentations, improvements to MIRS Rainfall Rate algorithm are in progress.
Contribution of F16 Rainfall to the MIRS Composite Precipitation Estimate MIRS Precipitation Estimate: N18, MetopA and F16 MIRS Precipitation Estimate: N18 and MetopA
Comparison Between MIRS and CPC Precipitation Over North America