Download
1 / 24
240 likes | 320 Views
“Development, Population and Pollution”. Anth 597.01. World population: 6,574,516,113 U.S. Population : 301,109,975 According to the International Programs Center , U.S. Bureau of the Census, Feb 06, 2007. 2004 World population. More developed regions: 1.2 billion

E N D
“Development, Population and Pollution” Anth 597.01
World population: 6,574,516,113U.S. Population: 301,109,975 According to the International Programs Center, U.S. Bureau of the Census, Feb 06, 2007
2004 World population • More developed regions: 1.2 billion • Less developed regions: 5.1 billion Source: U.S. Bureau of the Census, International Data Base • 47% Urban, 53% Rural (UN 2001)
Neo-Malthusian Revival • Subsistence can only keep up w/ population growth at cost of unsustainable level of env. destruction • Explanation for: • Famine • Poverty • Instability and revolution • Environmental degradation • Impeding development
Econonomic Development vs Pop. Growth • Does pop. growth have neg. effect on economic development? Why wouldn’t it? • Resources neither more scarce nor more expensive… yet • Efficient use of resources • More people to consume AND to produce • 0-20 /&/ 65-80+ = consumer • 20- 65 = net producer
Economies of scale • Increase in scale of the firm causes a decrease in long run average cost of each unit. • COSTCO Effect • More people = more demand for goods & services • drives capitalist economy • Population growth can stimulate agricultural and technological innovation • Danger might actually be in population decline
The Population Implosion • Population size is decreasing in many countries • Ex: Russia & ex-Soviet Block • Why? • Increased mortality • Alcoholism, drug abuse, disease, etc • Lower fertility • Cost/benefit of children in developed/developing countries
Relative Consumption Rates • The US - 4.6% of World’s pop • Uses 25% of the worlds energy • The US produces 25% of global greenhouse gases (UN 2001) • 30-50 Xs more consumption over lifetime • Child growing up in developed vs. undeveloped/developingcountry (UN 2001)
Economic development & Env degradation • Promotion of raw resource exports • Typically comes at cost to environment • Budget cuts in environmental protection • Brazil • env programs cut 2/3rds to meet IMF fiscal targets • Indonesia • budget cuts have forced officials in Jakarta, one of the world's most polluted cities, to suspend environmental programs. • Nicaragua • Ministry of Environment & Natural Resources budget cut 36% to adhere to IMF budget targets.
Conflict over scarce resources • Oil, natural gas, water • What does the future hold?
Deforestation • lost 3 billion hectares • (World Resources Institute) • ~ 16 million each year Why? • Logging – trees • Farming –Agriculture & Horticulture • Crops and Livestock • All = capital
The Story of Beef • Production = deforestation • 306 million acres of U.S. public land • Oregon, 3,000% more resources given to livestock than wildlife • destruction of up to 80% of rainforest in some Latin American countries • Inefficient & Messy • 80% U.S. grain = livestock feed • 2/3rds U.S. exports = International livestock feed • 1/4 of U.S. H2O grows grain for cattle • uses 15 times more H20 than equivalent vegetable protein • methane gas
(1997) The World Resources Institute. The Last Frontier Forest, Ecosystems and Economies on the Edge
The Dirty Dilemma • hazardous waste • Potentially damaging to the environment • harmful to humans and other living organisms • Industrial byproducts • Nuclear waste • Do we develop or save the environment?
Importing hazardous waste • Benefits? • Developed vs. Developing • Costs? • Developed vs. Developing
“Let them eat pollution” (The Economist, 1992) • World Bank should encourage migration of dirty industries to LDCs 1. income for LDCs 2. Cost of pollution assoc. illness = cheaper in LDCs 3. Grossly under-polluted 4. Lower life expectancies = less late onset diseases • “Commodification of human life” • People’s lives worthless in peripheral countries
Water pollution • Source: • Pesticides from land runoff • Chemicals from industry • Human waste • Result: • Dead/Deformed animals • Bioaccumulation - consumed in seafood • Dangerous swimming • 13,000 beaches closed in 2001 Cameron Wake, University of New Hampshire http://www.pbs.org/newshour/bb/environment/july-dec04/pollution_09-07.html
No Data Low High Water pollution Estimated DALYs per 1000 people resulting from mortality and morbidity associated with diarrhoeal diseases. DALY (Disability Adjusted Life Years) is a standard measure of health impact. (Source: World Bank Estimates)
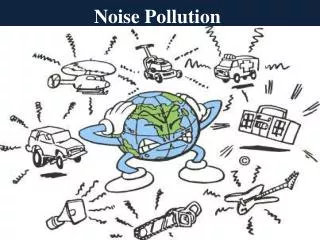
Air Pollution • Source: • fossil fuels, Methane, Chemicals, Smoke • Particulate Matter, Noxious gases • Result: • Smog • Ozone depletion • Acid rain • Health impacts • Asthma, Cancer, Stroke • contributes to some 60,000 deaths/year • Not local problem, but a global pollution dance Cameron Wake, University of New Hampshire http://www.pbs.org/newshour/bb/environment/july-dec04/pollution_09-07.html
No Data Low High Air Pollution concentration (ug/m3) of particulates (PM10) in urban areas (World Bank)
Global Climate Change • EPA estimates that in the last 50 years… • Carbon dioxide 30 percent • Methane 50 percent • Nitrous oxide 15 percent • Fossil fuels make up 80% of global energy use • Science • Threat to environment & inhabitants • Industry advocates • green policies will harm consumers • Natural climatic variability • Not enough evidence
Addressing the problem • Kyoto Protocol, 2005 • 140 countries ratified • international agreement to reduce emission of greenhouse gases to pre-1990 levels by 2012 • Bush Admin has not ratified the protocol • mandatory restrictions on emissions could hurt large industry • damage the U.S. economy by making it less competitive • Local & State level participation • 418 cities in all 50 states support K - protocol • Carbon Trading/Credits • Regional Greenhouse Gas Initiative (RGGI) • Places cap on total emissions • Credits to individual emitters • Buy or sell credits in market to meet targets
Global Climate Change • Carbon trading/greenhouse gas emissions trading • Enacted by legislation of a state/country/region • Places a cap on total emissions • Allocates credits to individual emitters • Then allows them to buy or sell credits in a market to meet their targets • Cost-effective & efficient way to lower emissions • Provides flexibility for companies • Works best in concentrated sectors • Power plants/Industry vs. Ag/Transportation • What can you do?