Exploring Cache Memory Performance Metrics: A Programmer's Perspective
180 likes | 267 Views
Delve into cache memory metrics and performance calculations based on CS:APP, focusing on hit rates, miss penalties, and average memory access times to optimize system performance and reduce memory stalls.

Exploring Cache Memory Performance Metrics: A Programmer's Perspective
E N D
Presentation Transcript
Cache Memory and Performance Many of the following slides are taken with permission from Complete Powerpoint Lecture Notes forComputer Systems: A Programmer's Perspective (CS:APP) Randal E. Bryant and David R. O'Hallaron http://csapp.cs.cmu.edu/public/lectures.html The book is used explicitly in CS 2505 and CS 3214 and as a reference in CS 2506.
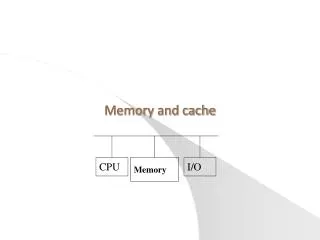
Cache Memories • Cache memories are small, fast SRAM-based memories managed automatically in hardware. • Hold frequently accessed blocks of main memory • CPU looks first for data in caches (e.g., L1, L2, and L3), then in main memory. • Typical system structure: CPU chip Register file ALU Cache memories System bus Memory bus Main memory Bus interface I/O bridge
General Cache Organization (S, E, B) E = 2e lines (blocks) per set 1 0 2e-1 set 0 line (block) 1 2 S = 2s sets 3 2s-1 tag 0 1 2 B-1 v valid bit Cache size: C = S x E x B data bytes B = 2b bytes per cache block (the data)
Cache Organization Types • The "geometry" of the cache is defined by: • S = 2s the number of sets in the cache • E = 2e the number of lines (blocks) in a set • B = 2b the number of bytes in a line (block) • E = 1 (e = 0) direct-mapped cache • only one possible location in cache for each DRAM block • S > 1 • E = K > 1K-way associative cache • K possible locations (in same cache set) for each DRAM block • S = 1 (only one set) fully-associative cache • E = # of cache blockseach DRAM block can be at any location in the cache
Cache Performance Metrics • miss rate: fraction of memory references not found in cache (# misses / # accesses)= 1 – hit rate Typical miss rates: - 3-10% for L1 - can be quite small (e.g., < 1%) for L2, depending on cache size and locality • hit time: time to deliver a line in the cache to the processor includes time to determine whether the line is in the cache Typical times: - 1-2 clock cycle for L1 - 5-20 clock cycles for L2 • miss penalty: additional time required for data access because of a cache miss typically 50-200 cycles for main memory Trend is for increasing # of cycles… why?
Calculating Average Access Time • Let’s say that we have two levels of cache, backed by DRAM: • - L1 cache costs 1 cycle to access and has miss rate of 10% • - L2 cache costs 10 cycles to access and has miss rate of 2% • - DRAM costs 80 cycles to access (and has miss rate of 0%) • Then the average memory access time (AMAT) would be: • 1 + always access L1 cache • 0.10 * 10 + probability miss in L1 cache * time to access L2 • 0.10 * 0.02 * 80 probability miss in L1 cache * • probability miss in L2 cache * time to access DRAM • = 2.16 cycles
Calculating Average Access Time • Alternatively, we could say: • 0.90 * 1 + probability hit in L1 cache * time to access L1 • 0.10 * probability miss in L1 cache * • 0.98 * (10 + 1) probability hit in L2 cache * time to access L1 then L2 • 0.10 * probability miss in L1 cache * • 0.02 * probability miss in L2 cache * • (1 + 10 + 80) time to access L1 then L2 then DRAM • = 2.16 cycles
Lets think about those numbers • There can be a huge difference between the cost of a hit and a miss. Could be 100x, if just L1 and main memory • Would you believe 99% hits is twice as good as 97%? Consider: L1 cache hit time of 1 cycle L1 miss penalty of 100 cycles (to DRAM) Average access time: 97% L1 hits: 1 cycle + 0.03 * 100 cycles =4 cycles 99% L1 hits: 1 cycle + 0.01 * 100 cycles = 2 cycles
Measuring Cache Performance • Components of CPU time: Program execution cycles Includes cache hit time Memory stall cycles Mainly from cache misses • With simplifying assumptions:
Cache Performance Example • Given - Instruction-cache miss rate = 2% - Data-cache miss rate = 4% - Miss penalty = 100 cycles - Base CPI (with ideal cache performance) = 2 - Load & stores are 36% of instructions • Miss cycles per instruction - Instruction-cache: 0.02 × 100 = 2 - Data-cache: 0.36 × 0.04 × 100 = 1.44 • Actual CPI = 2 + 2 + 1.44 = 5.44 - Ideal CPU is 5.44/2 =2.72 times faster - We spend 3.44/5.44 = 63% of our execution time on memory stalls!
Reduce Ideal CPI • What if we improved the datapath so that the average ideal CPI was reduced? - Instruction-cache miss rate = 2% - Data-cache miss rate = 4% - Miss penalty = 100 cycles - Base CPI (with ideal cache performance) = 1.5 - Load & stores are 36% of instructions • Miss cycles per instruction will still be the same as before. • Actual CPI = 1.5 + 2 + 1.44 = 4.94 - Ideal CPU is 4.94/1.5 =3.29 times faster - We spend 3.44/4.94 = 70% of our execution time on memory stalls!
Performance Summary • When CPU performance increases - effect of miss penalty becomes more significant • Decreasing base CPI - greater proportion of time spent on memory stalls • Increasing clock rate - memory stalls account for more CPU cycles • Can’t neglect cache behavior when evaluating system performance
Multilevel Cache Considerations • Primary cache • Focus on minimal hit time • L-2 cache • Focus on low miss rate to avoid main memory access • Hit time has less overall impact • Results • L-1 cache usually smaller than a single cache • L-1 block size smaller than L-2 block size
Intel Core i7 Cache Hierarchy Processor package Core 0 Core 3 Regs Regs • L1 i-cache and d-cache: • 32 KB, 8-way, • Access: 4 cycles • L2 unified cache: • 256 KB, 8-way, • Access: 11 cycles • L3 unified cache: • 8 MB, 16-way, • Access: 30-40 cycles • Block size: 64 bytes for all caches. L1 d-cache L1 i-cache L1 d-cache L1 i-cache … L2 unified cache L2 unified cache L3 unified cache (shared by all cores) Main memory
What about writes? • Multiple copies of data may exist: - L1 - L2 - DRAM - Disk Remember: each level of the hierarchy is a subset of the one below it. • Suppose we write to a data block that's in L1. • If we update only the copy in L1, then we will have multiple, inconsistent versions! • If we update all the copies, we'll incur a substantial time penalty! • And what if we write to a data block that's not in L1?
What about writes? • What to do on a write-hit? Write-through (write immediately to memory) Write-back (defer write to memory until replacement of line) Need a dirty bit (line different from memory or not)
What about writes? • What to do on a write-miss? Write-allocate (load into cache, update line in cache) Good if more writes to the location follow No-write-allocate (writes immediately to memory) • Typical combinations: Write-through + No-write-allocate Write-back + Write-allocate