Download
1 / 5
50 likes | 120 Views
Plot markers by sample for data taken from multiple locations. Choose markers by analyte for time series data. Enter experimental data or water sample analyses into GSS . Choose marker color, shape, and size for plotting. Graphs → XY Plot.

E N D
Plot markers by sample for data taken from multiple locations. Choose markers by analyte for time series data. Enter experimental data or water sample analyses into GSS. Choose marker color, shape, and size for plotting.
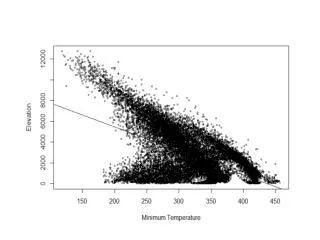
Graphs → XY Plot An XY Plot shows a plot of fluid composition, with one component on the x axis and one or more components on the y axis. A Time series Plot is a special type of XY Plot.
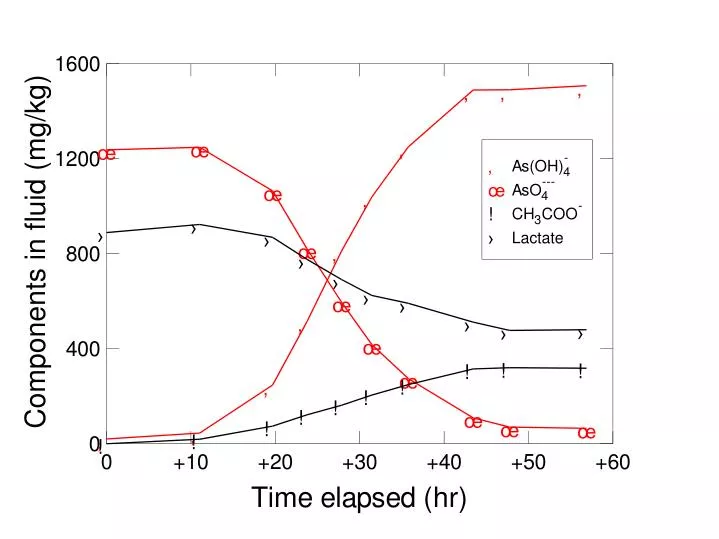
GSS launches data in Gtplot. Change scale and units, make linear, log, or delta plots, etc. X Axis → System parameters → Time elapsed Y Axis → Components in fluid → As(OH)4−,...
Turn sample labels and legends on or off. Add connecting lines.