Download
1 / 18
180 likes | 278 Views
APEIS Capacity Building Workshop on Integrated Environment Assessment in the Asia Pacific Region October 24-26, 2002 Hotel Grand Inter-Continental, New Delhi. AIM/Emission Model. Mikiko Kainuma. National Institute for Environmental Studies. Computable General Equilibrium Model

E N D
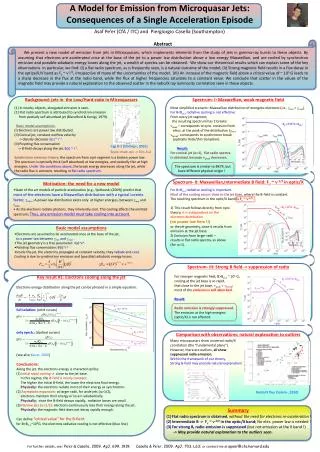
APEIS Capacity Building Workshop on Integrated Environment Assessment in the Asia Pacific Region October 24-26, 2002 Hotel Grand Inter-Continental, New Delhi AIM/Emission Model Mikiko Kainuma National Institute for Environmental Studies
Computable General Equilibrium Model (AIM/Top-down) Bottom-up technology & land use Model (AIM/Bottom-up) Bottom-up technology & land use Model (AIM/Bottom-up) Bottom-up technology & land use Model (AIM/Bottom-up) Development of AIM/Top-down &AIM/Bottom-up World level Country level ・・・
International trade Outline of AIM/Global CGE
Japan USA EU Russia 0.10 0.00 -0.10 GDP Change (% from baseline) -0.20 -0.30 -0.40 -0.50 With USA (Left) Without USA (Right) Economic Impacts of Kyoto Protocol with and without USA (Without Emission Trading and with sink)
Without emissions trading Emissions trading (Annex B ) Emissions trading (Annex B, 50% Banking) Japan US EU CIS Economic Impact of the Kyoto Protocol without US - Mitigation - 1.00 0.80 0.60 0.40 Change of GDP (% from baseline) 0.20 0.00 -0.20 -0.40 -0.60
80.0 70.4 70.0 56.3 60.0 50.0 40.0 31.6 US$/C 30.0 16.6 20.0 10.0 0.0 Within Annex B Within Annex B (50% Banking) With US (Left) Without US (Right) Carbon price (Emissions Trading) (in 2010)
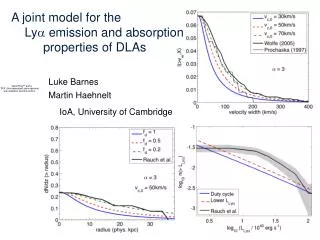
(b) WRE 550 ppm (a) reference World energy demand in end use sectors under (a) the reference scenario and (b) WRE 550 scenario.
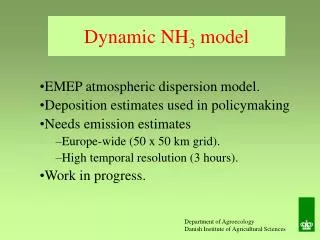
- Heating - Oil - Boiler - Lighting - Coal - Power generation - Steel products - Gas - Blast furnace - Cooling - Solar - Air conditioner - Transportation - ( Electricity) - Automobile Energy Service Energy Energy Technology Energy Consumption Technology Service Demand CO2 Emissions Energy Database Technology Database Socio - economic Scenario - Population Growth - Technology price - Energy type - Economic Growth - Energy consumption - Energy price - Industrial Structure - Service supplied - Energy constraints - Employees - Share - CO2 emission factor - Lifestyle - Lifetime Frame of the AIM/Enduse Model
Output tables Link with GIS sytem AIM/Enduse Database Structure of the AIM/Enduse Model
A1 A2 B1 B2 123 114 113 110 133 112 105 99 A1 A2 A2 A1 Estimates of CO2 Emission in Japan with AIM/Enduse model B1 B1 B2 B2 < Reference case > 1,600 A1 1,400 1,200 A2 B1 B2 1,000 CO2 Emission (MtCO2) 800 600 400 200 (1990=100) 0 1990 2000 2010 2020
A1 A2 B1 B2 2% per year Below 1% 1.5% per year 0.5% per year A2 A1 Estimates of CO2 Emission in Japan with AIM/Enduse model B1 B2
A1 A2 A2 A1 B1 B2 B1 B2 Shift to Service Industry Oil and coal are main energy Atomic power plant Retain material industries Advanced technology Lifestyle change Estimates of CO2 Emission in Japan with AIM end-use model
A2 A1 B1 B2 A1 A2 B1 B2 102 96 98 96 105 88 87 83 A1 A2 Estimates of CO2 Emission in Japan with AIM end-use model B1 B2 < Countermeasure case > 1,600 1,400 1,200 A1 1,000 A2 B1 CO2 Emission (MtCO2) B2 800 600 400 200 (1990=100) 0 1990 2000 2010 2020
2000 2030 Million Ton Million Ton Mt-CO2 Mt-CO2 < 3 0 3 - 6 5 6 - 9 9 - 12 10 12 - 15 15 15 - 18 20 18 - 21 > 21 40 Regional distribution of CO2 emissions in India for 2000 and 2030 in reference scenario Note: Circles show emissions from large point sources.
Coal power plant Gas power plant Coal Powe r Plant Gas Power Plant Reference scenario Reference Scenario 550 ppmv Scenario 550 ppmv scenario Mt-CO2 Million Ton < 3 3 – 6 6 – 9 9 – 12 12 – 15 15 – 18 18 – 21 > 21 Comparison of CO2 emissions from large power plants in India in reference and 550 ppmv stabilization scenarios in 2030
(kg-SO2/km2) (t-C/km2) 0 500 1,000 1,500 ≧1,600 0 5,000 10,000 15,000 ≧16,000 SO2 emissions intensity in China for 2010 CO2 emissions intensity in China for 2010