Download
1 / 16
160 likes | 257 Views
TNO MACC-II European emissions. Model-ready emission set for 2003-2009 Jeroen Kuenen, Hugo Denier van der Gon, Antoon Visschedijk TNO, Utrecht, The Netherlands. Outline. Motivation Emission database PM split in components Spatial distribution

E N D
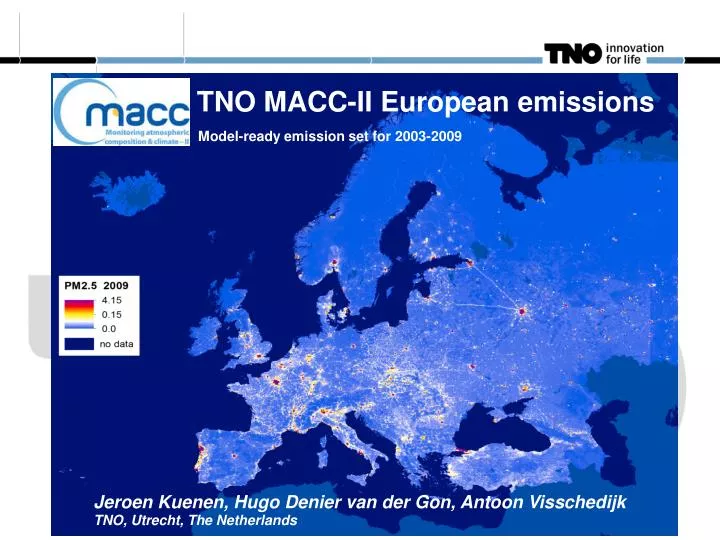
TNO MACC-II European emissions Model-ready emission set for 2003-2009 Jeroen Kuenen, Hugo Denier van der Gon, Antoon Visschedijk TNO, Utrecht, The Netherlands
Jeroen Kuenen MACC-II European emissions Outline • Motivation • Emission database • PM split in components • Spatial distribution • Conclusions and future work
Jeroen Kuenen MACC-II European emissions Motivation • Air quality models needs good quality emission input, which should... • describe all (anthropogenic) sources • be consistent in time and space • provide the best (scientific) estimate for the emission • Why develop this inventory? • Good emissions are the start of any environmental assessment • However, simply taking EMEP (gridded) emissions does not work • Gridded data are 50x50 km2 and not always available • Reported emissions is following guidelines, which is not necesserily applying the best science • Often not consistent between (neighbouring) countries
Jeroen Kuenen MACC-II European emissions TNO_MACC-II emission inventory Updating and improving TNO_MACC inventory Improved point source representation Improved variation between years, adding 2008-2009 Harmonization with latest reporting to the extent possible Spatial resolution 1/8 x 1/16 degrees (lon/lat) ~ 7x7km Pollutants covered: NOx, SO2, NMVOC, NH3 CH4, CO PM10, PM2.5 (and components)
Jeroen Kuenen MACC-II European emissions Reported emissions • In the ideal case, reported emissions from countries would be directly usable as input for AQ modelling • This means that the largest contributing sectors are as expected, or else the difference can be explained • This also means that trends in time series are understandable • This works fine for a country like Germany... • But... • A thorough check of availability and quality of reported data is crucial! Differences from (e.g.) • Errors in the data • Resubmissions by countries • Every historical year is reported every year, and methods change!
Jeroen Kuenen MACC-II European emissions Methodology in a nutshell • Make use of official reported emissions (as of end 2011) where possible (staying as close as possible to what is used in policy) • Reported emissions by source category (NFR/CRF) • Disaggregated using IIASA GAINS emissions to 75 source categories • Direct use of IIASA GAINS emissions in cases where reported data is not available or is not good enough • Corrections for specific sectors/pollutants, e.g.: • NOx and NMVOC from agriculture excluded • Agricultural waste burning from GAINS for all countries • CO not in GAINS; use of TNO internal bottom-up database • Armenia, Azerbaijan, Georgia not in GAINS: data from EDGAR • International shipping added from CEIP; additional in-port emissions from TNO expert judgement
Jeroen Kuenen MACC-II European emissions Results • Consistent emission dataset for Europe (43 countries, 5 seas) and 8 pollutants, for 77 different source & fuel combinations SNAP source categories: 1 energy industry 2 residential combustion 3-4 industry 5 extraction/distribution FF 6 product use 7 road transport 8 other mobile sources 9 waste 10 agriculture
Jeroen Kuenen MACC-II European emissions Change in emission
Jeroen Kuenen MACC-II European emissions PM components SNAP source categories: 1 energy industry 2 residential combustion 3-4 industry 5 extraction/distribution FF 6 product use 7 road transport 8 other mobile sources 9 waste Agriculture • PM is a mix of many things, models need underlying information (PM split) • Generic PM split (per SNAP) not good enough, because different fuels result in very different PM composition • PM split defined per detailed source/fuel combination underlying the dataset (>200 categories) • For both coarse & fine mode, split in EC, OC (full molecular mass), SO4, Na, other minerals • Split based on literature where available, and expert judgement where needed
Jeroen Kuenen MACC-II European emissions Spatial distribution • Use generic spatial distribution system throughout Europe • All emission sources distributed using proxy parameters, e.g. • Population density (total, rural, urban) • Road network for non-urban emissions
Jeroen Kuenen MACC-II European emissions Point sources • Use of European Pollutant Release and Transfer Register (and predecessor EPER): http://prtr.ec.europa.eu • EPER: 2001 and 2004 • E-PRTR: annual data from 2007 onwards • Used in TNO-MACC-II as relative proxy for distributing emissions for specific sector/fuel combinations (2004 proxy for years 2003-2005, 2007 also for 2006) • Where E-PRTR data not available or not suitable, TNO PS info from TNO_MACC-I has been used as proxy for distributing emissions
SO2 in 2009 Jeroen Kuenen MACC-II European emissions Resulting emission maps NH3 in 2003
EC 2009 – 2003 EC 2009 Jeroen Kuenen MACC-II European emissions NOx 2009 – 2003 NOx 2009
Jeroen Kuenen MACC-II European emissions Conclusion and outlook • TNO_MACC-II: consistent and complete emission inventory for UNECE-Europe, in line with official emissions and suitable for policy analysis and support using AQ models • Already used in various research activities involving modelling e.g. MACC-II, AQMEII-2 model intercomparison study • Outlook; what we would like to do more • Add more years (2010) • Various semi-natural sources exist that are important for modelling AQ but not (well) covered in the reported emissions • Examples: Agricultural waste burning, resuspension by road transport, Soil NOx emissions • “on the side” we aim to make data on semi-natural sources available as model input in the same format
Jeroen Kuenen MACC-II European emissions Thank you for your attention! Poster: E. Dammers et al., “A regional analysis of biogenic soil NOxemissions across Europe”Soil NOx adds 0.39-0.49 Tg N for Europe (~10%) Soil NOx Emissions in This work was funded by Interested in using TNO_MACC-II data? Please contact us! jeroen.kuenen@tno.nl; hugo.deniervandergon@tno.nl