Download
1 / 19
200 likes | 322 Views
Effective Executive Reporting and Key Performance Indicators.

E N D
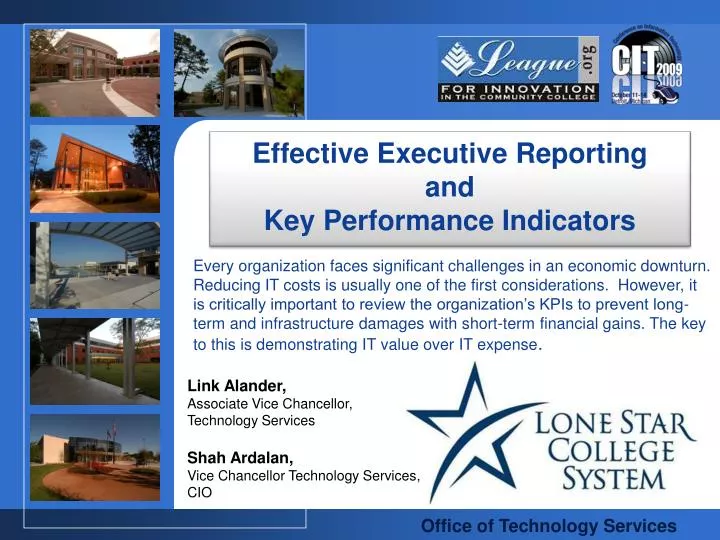
Effective Executive Reporting and Key Performance Indicators Every organization faces significant challenges in an economic downturn. Reducing IT costs is usually one of the first considerations. However, it is critically important to review the organization’s KPIs to prevent long-term and infrastructure damages with short-term financial gains. The key to this is demonstrating IT value over IT expense. Link Alander, Associate Vice Chancellor, Technology Services Shah Ardalan, Vice Chancellor Technology Services, CIO
Presentation Overview Problem Statement • How many are of you are facing budget cuts? • As an institution • As a department • How many of you have a hiring freeze right now? • Official • Unofficial • Does your organization feel that IT is draining resources and not providing value to the organization? • Are you a business partner? • Introduction • Lone Star College System • Office of Technology Services • Challenges • Key Performance Indicators • Internal and External • Measuring • Rethinking what we measure • Executive Reporting • Don’t forget your customers • Is Service Delivery Slipping? • Keys to Our Success • Planning, Measuring and Reporting • Questions and Answers
Lone Star College System Lone Star College System • 75,000+ students • 5-8 % avg. growth per year • (15% in 2009) • 5 Colleges • LSC-CyFair • LSC-Kingwood • LSC-North Harris • LSC-Montgomery • LSC-Tomball • LSC-University Center • LSC-University Park • 9 Educational Outreach Centers • 5,000 Employees • Expanding our facilities • 21 new buildings LSC-University Park
Office of Technology Services IT Governance Formal Governance Structure Strategic Plan for IT Guiding Principles Customer Satisfaction • 5-Nines Service Delivery • Enterprise Standards Key Performance Indicators • Financial • Operational • Strategic • Open Executive Reporting • Restructured May of 2008 • 6 entities into 1 • 140 staff members • Supported Systems • 12,000+ desktop systems • 4,800+ network devices • 475+ file servers • 30 Major Technology Initiatives
Times are Tough! • Early Trends in Technology Budgets for 2009-10 The impact on IT spending of the unprecedented deterioration in global economic conditions is becoming clearer. In our 1Q09 forecast update, Gartner's most likely forecast for global IT spending in 2009 has been revised down to -3.8% annual growth in U.S. dollar terms. April, 2009 • Budget Trends– Higher Education • Planning cuts of 5 to 15 percent for FY09-10 • Many are administering mid year cuts • Sentiment was budget cuts would be deep and long lasting January, 2009
Our Approach and Challenges At what point do you add value to the organization? • Monitor and Track Performance • It doesn’t have to be complex • Assign tracking responsibility • Report Progress • Meaningful Information to our Executives and Board of Trustees • Provide Continuous Improvement IT Maturity Model and Assessment Challenge Prior to 2008 – IT was not seen as a business partner Goal Increase Accountability, IT Maturity, Show Value and become a Business Partner
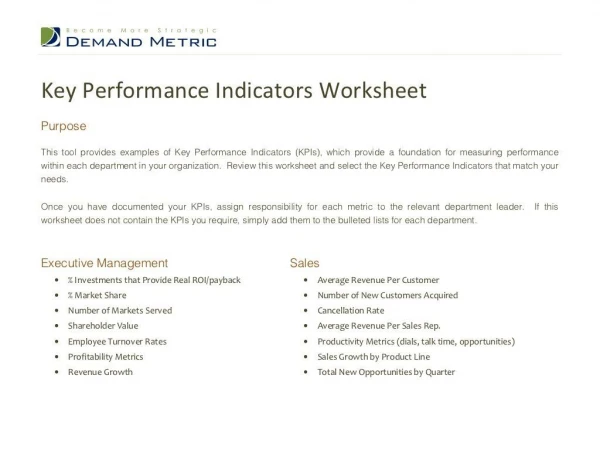
Key Performance Indicators Once an organization has analyzed its mission, identified all its stakeholders, and defined its goals, it needs a way to measure progress toward those goals. Key Performance Indicators are those measurements. • “If you don’t measure it, • you can’t manage it” • “If you don’t measure it, • you can’t improve it” • “If you don’t measure it, • you probably don’t care” • “If you can’t influence it, • then don’t measure it” • Randy A Steinberg • Don’t over estimate your capabilities • Align with your Strategic Plan • Traditional KPIs • Financial • Operational • Strategic • External and Internal - KPIs • Assign Responsibility • Report Regularly • Rethink (remix) your KPIs • Show Value to the Organization and our Taxpayers
External KPIs - Traditional Why external and internal KPIs Aligned with Goals Simplified and targeted Strategic in nature Manage expectations Document your KPIs What are you measuring? Why are you measuring? How are you measuring?
IT Service Management – Measuring Availability Critical Factors – Documented Practices • Measuring Service Availability • Measuring Service Impact Recorded system service availability is: Location X = 44,370/(44,640-240) = 99.90% Impact = 55,000-3,000/55,000 = 5.45% System availability = Total availability by Site Weighted. Total Service Uptime (Total Minutes – Planned Downtime) (Total Service Users – Impacted Users) Total Service Users Example: 30 minute network outage at a remote campus that impact 3,000 students, faculty and staff. All other locations were not impacted. Any impact greater then 10% is considered a total loss of service.
Measuring Change and Problem Management • Problem Management • - Number of major problems • - Number of repeat incidents • - Total labor hours spent on problems Change Management • Change success rate • Emergency change rate • Change efficiency rate • Change incident rate • Change reschedule rate
Internal KPIs Benefits of Internal KPIs Measure More! Higher Standards Establishes who is accountable Same Principles Apply Define the KPI Goals Reporting
Rethinking (REMIX) your KPIs • Relative KPI’s • Patch management compliance % • Antivirus compliance % • Backup system performance • Backup system tests • External Security Assessments What are Risk Performance Indicators? • Patch Management • Antivirus definitions • Backup system performance Why measure Risk Performance Indicators? • To make sure they are being watched Should I report these? • Yes • To senior IT leadership • To process owners responsible
Rethinking (REMIX) your KPIs • Relative KPI’s • % of systems with Entergy Star 5 Rating • % of systems with advanced power management • % reduction of energy costs • Desktops • Datacenter • % of call resolutions resolved with automation • % of administrative costs by fiscal year or quarter Measure Technology Initiatives that add value • Long term vs. short term projects • Establish KPIs (project and future) from the start • Examples • Green IT • Implement and measure a green standard for all IT systems • Goal – Reduce energy consumption by 50 % within 3 years • Risk Reduction using Automation • Implement desktop management systems to improve customer satisfaction, patch and security management • Administrative Cost Reduction • Review organizational and cost structures shift expenses to operational support when possible
Watch the Bottom Line! Is Service Delivery Slipping? • Traditional – Customer Satisfaction Survey’s • Work order completion surveys • Call center metrics
Watch the Bottom Line! Continuing economic hardships require many IT operations organizations to assess their core competencies and the costs of service delivery. May, 2009 Is Service Delivery Slipping? • Non Traditional (Perception) • Semiannual survey – faculty and students • Open forums • Small target group sessions • Technology advisory councils
Reporting While KPIs add value to your operation they don’t add value to the organization unless you regularly report them. • Monthly Executive Overview Report • Keep it simple (Geek-less meaningful communication) • Report KPIs • Highlight items that have value • Customer Newsletter • Open forums • Faculty and Staff updates • Tips and tricks • Ways to reduce calls by expanding knowledge • Student Welcome Back Event • Event and newsletter for students
Keys to our Success Constant Communication with “ALL” Stakeholders • Planning • IT Governance • Alignment with Institutions Strategic Plan • Technology Plan – Strategic and Tactical • Communication & Branding Plans 2) Measuring • External and Internal KPIs • Monitoring Service Delivery and Customer Satisfaction • Monitoring Perception of Technology Services • Reporting • Executive Reporting • Customer Newsletters (Students, Faculty and Staff) • Technology Advisory Councils
Rewards • We are Hiring! • This fiscal year we are adding • 20 • new positions New Resources • 5.7 million was allocated system-wide for special project funding • OTS received 2.9 million By implementing simple KPIs, remixing KPIs to show value and constant reporting. The LSCS Office of Technology Services has not faced the significant challenges that other Higher Education IT organizations are facing.
Questions? Effective Executive Reporting and Key Performance Indicators Link Alander, Associate Vice Chancellor, Technology Services Shah Ardalan, Vice Chancellor Technology Services, CIO Presentation Resources Gartner Reports G00154802 G00165225 G00159978 EduCause ECAR – Managing the Funding Gap Measuring ITIL - Randy A Steinberg