1 / 3
30 likes | 58 Views
Get this template plus 350 other premium business tools & templates at www.demandmetric.com

E N D
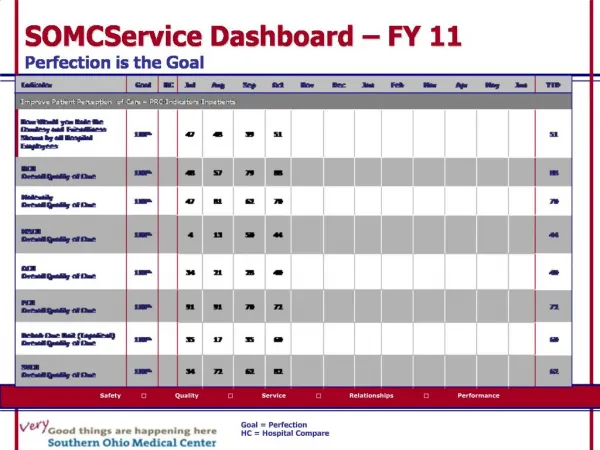
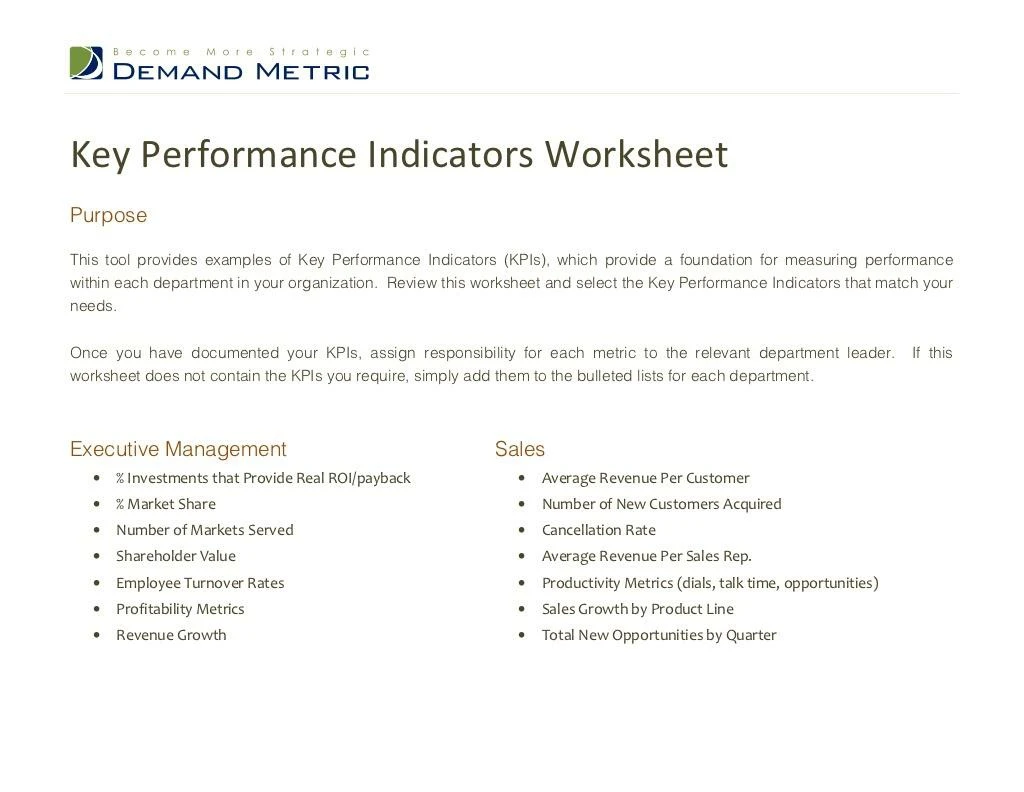
Key Performance Indicators Worksheet Key Performance Indicators WorksheetPurposeThis tool provides examples of Key Performance Indicators (KPIs), which provide a foundation for measuring performancewithin each department in your organization. Review this worksheet and select the Key Performance Indicators that match yourneeds.Once you have documented your KPIs, assign responsibility for each metric to the relevant department leader. If thisworksheet does not contain the KPIs you require, simply add them to the bulleted lists for each department.Executive Management Sales • % Investments that Provide Real ROI/payback • Average Revenue Per Customer • % Market Share • Number of New Customers Acquired • Number of Markets Served • Cancellation Rate • Shareholder Value • Average Revenue Per Sales Rep. • Employee Turnover Rates • Productivity Metrics (dials, talk time, opportunities) • Profitability Metrics • Sales Growth by Product Line • Revenue Growth • Total New Opportunities by Quarter
Operations & Information Technology Customer Service • Application Development Metrics • Customer Retention Rate • I/T Services Availability Metrics • Customer Satisfaction Survey Results • I/T Security & Disaster Recovery Metrics • Average Length of Customer (# years with firm) • Configuration Management Metrics • Average Customer Lifetime Value (years x avg. rev.) • Project Metrics • Customer Support Ticket Resolution Time • Web Metrics • % Support Calls Requiring Escalation • I/T Financial & Value Metrics • Average # Support Calls Resolved/Hour • Operations & Process MetricsMarketing Finance • Campaign Return on Investment • Percentage of Bad Debts (collection) • Campaign Response Rates • Profitability of Market Segments • Website Visitors, Page views etc. • Age of Receivables/Payables • Direct Revenues (e-commerce) • Profitability Ratios (Gross Profit/Sales, ROE, ROA, etc) • Distributor/Partner Sales Metrics • Investment Ratios (Inventory Turnover) • Number of Qualified Leads • Stability Ratios (Debt/Equity, Net Worth/Assets) • New Leads Per Quarter • Liquidity Ratios (Current, Acid Test, Working Capital) • Closing Rate for Leads • Growth Ratios (Profit, Sales, and Asset Growth) • Brand Equity & Valuation • Risk Analysis (Margin of Safety, ROI, Payback) Operations & Information Technology Customer Service • Application Development Metrics • Customer Retention Rate • I/T Services Availability Metrics • Customer Satisfaction Survey Results • I/T Security & Disaster Recovery Metrics • Average Length of Customer (# years with firm) • Configuration Management Metrics • Average Customer Lifetime Value (years x avg. rev.) • Project Metrics • Customer Support Ticket Resolution Time • Web Metrics • % Support Calls Requiring Escalation • I/T Financial & Value Metrics • Average # Support Calls Resolved/Hour • Operations & Process MetricsMarketing Finance • Campaign Return on Investment • Percentage of Bad Debts (collection) • Campaign Response Rates • Profitability of Market Segments • Website Visitors, Page views etc. • Age of Receivables/Payables • Direct Revenues (e-commerce) • Profitability Ratios (Gross Profit/Sales, ROE, ROA, etc) • Distributor/Partner Sales Metrics • Investment Ratios (Inventory Turnover) • Number of Qualified Leads • Stability Ratios (Debt/Equity, Net Worth/Assets) • New Leads Per Quarter • Liquidity Ratios (Current, Acid Test, Working Capital) • Closing Rate for Leads • Growth Ratios (Profit, Sales, and Asset Growth) • Brand Equity & Valuation • Risk Analysis (Margin of Safety, ROI, Payback)
• Brand Perception Survey Results • Total Number of CustomersProduct Development Human Resources • Unit Contribution • Employee Satisfaction Survey Results • Contribution Margin Ratio • Total Number of Employees • Product Break-even Points • Cost of Employee Turnover • Total Quality Management, Six Sigma, ISO • Employee Attrition Rate • New Product Sales • % High Performing Employees • Product Enhancements/Year • Number of Applicants by Source • Product Development Survey Results • % Interviews/Hires • Brand Perception Survey Results • Total Number of CustomersProduct Development Human Resources • Unit Contribution • Employee Satisfaction Survey Results • Contribution Margin Ratio • Total Number of Employees • Product Break-even Points • Cost of Employee Turnover • Total Quality Management, Six Sigma, ISO • Employee Attrition Rate • New Product Sales • % High Performing Employees • Product Enhancements/Year • Number of Applicants by Source • Product Development Survey Results • % Interviews/Hires