Download
1 / 14
140 likes | 299 Views
Cross Section Average Comparisons. John D. McMillen. Cross Section Locations. 0400 27 Oct 10. CTRL. MY. A. A. A. A. B. B. B. B. WDM6. SBUYLIN.

E N D
Cross SectionAverage Comparisons John D. McMillen
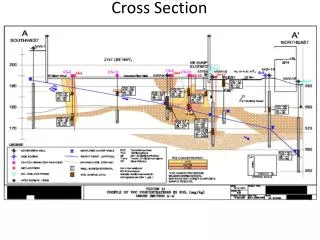
0400 27 Oct 10 CTRL MY A A A A B B B B WDM6 SBUYLIN Plots of Total precipitation mixing ratio (black,g kg^-1, Low 0.05, Interval 0.5), Total cloud mixing ratio (blue, g kg^-1, Low 0.01, Interval 0.5), and Convergence (1x10^-5 s^-1,Low -500, High -100; -100x10^-5 s^-1 is the scale of convective convergence). Values are averaged across the cross section.
0400 27 Oct 10 CTRL MY A’ A’ A’ A’ B’ B’ B’ B’ WDM6 SBUYLIN Plots of Total precipitation mixing ratio (black,g kg^-1, Low 0.05, Interval 0.5), Total cloud mixing ratio (blue, g kg^-1, Low 0.01, Interval 0.5), and Convergence (1x10^-5 s^-1,Low -500, High -100; -100x10^-5 s^-1 is the scale of convective convergence). Values are averaged across the cross section.
0400 27 Oct 10 CTRL MY A” A” A” A” B” B” B” B” WDM6 SBUYLIN Plots of Total precipitation mixing ratio (black,g kg^-1, Low 0.05, Interval 0.5), Total cloud mixing ratio (blue, g kg^-1, Low 0.01, Interval 0.5), and Convergence (1x10^-5 s^-1,Low -500, High -100; -100x10^-5 s^-1 is the scale of convective convergence). Values are averaged across the cross section.
0600 27 Oct 10 CTRL MY A A A A B B B B WDM6 SBUYLIN Plots of Total precipitation mixing ratio (black,g kg^-1, Low 0.05, Interval 0.5), Total cloud mixing ratio (blue, g kg^-1, Low 0.01, Interval 0.5), and Convergence (1x10^-5 s^-1,Low -500, High -100; -100x10^-5 s^-1 is the scale of convective convergence). Values are averaged across the cross section.
0600 27 Oct 10 CTRL MY A’ A’ A’ A’ B’ B’ B’ B’ WDM6 SBUYLIN Plots of Total precipitation mixing ratio (black,g kg^-1, Low 0.05, Interval 0.5), Total cloud mixing ratio (blue, g kg^-1, Low 0.01, Interval 0.5), and Convergence (1x10^-5 s^-1,Low -500, High -100; -100x10^-5 s^-1 is the scale of convective convergence). Values are averaged across the cross section.
0600 27 Oct 10 CTRL MY A” A” A” A” B” B” B” B” WDM6 SBUYLIN Plots of Total precipitation mixing ratio (black,g kg^-1, Low 0.05, Interval 0.5), Total cloud mixing ratio (blue, g kg^-1, Low 0.01, Interval 0.5), and Convergence (1x10^-5 s^-1,Low -500, High -100; -100x10^-5 s^-1 is the scale of convective convergence). Values are averaged across the cross section.
0900 27 Oct 10 CTRL MY A A A A B B B B WDM6 SBUYLIN Plots of Total precipitation mixing ratio (black,g kg^-1, Low 0.05, Interval 0.5), Total cloud mixing ratio (blue, g kg^-1, Low 0.01, Interval 0.5), and Convergence (1x10^-5 s^-1,Low -500, High -100; -100x10^-5 s^-1 is the scale of convective convergence). Values are averaged across the cross section.
0900 27 Oct 10 CTRL MY A’ A’ A’ A’ B’ B’ B’ B’ WDM6 SBUYLIN Plots of Total precipitation mixing ratio (black,g kg^-1, Low 0.05, Interval 0.5), Total cloud mixing ratio (blue, g kg^-1, Low 0.01, Interval 0.5), and Convergence (1x10^-5 s^-1,Low -500, High -100; -100x10^-5 s^-1 is the scale of convective convergence). Values are averaged across the cross section.
0900 27 Oct 10 CTRL MY A” A” A” A” B” B” B” B” WDM6 SBUYLIN Plots of Total precipitation mixing ratio (black,g kg^-1, Low 0.05, Interval 0.5), Total cloud mixing ratio (blue, g kg^-1, Low 0.01, Interval 0.5), and Convergence (1x10^-5 s^-1,Low -500, High -100; -100x10^-5 s^-1 is the scale of convective convergence). Values are averaged across the cross section.
1100 27 Oct 10 CTRL MY A A A A B B B B WDM6 SBUYLIN Plots of Total precipitation mixing ratio (black,g kg^-1, Low 0.05, Interval 0.5), Total cloud mixing ratio (blue, g kg^-1, Low 0.01, Interval 0.5), and Convergence (1x10^-5 s^-1,Low -500, High -100; -100x10^-5 s^-1 is the scale of convective convergence). Values are averaged across the cross section.
1100 27 Oct 10 CTRL MY A’ A’ A’ A’ B’ B’ B’ B’ WDM6 SBUYLIN Plots of Total precipitation mixing ratio (black,g kg^-1, Low 0.05, Interval 0.5), Total cloud mixing ratio (blue, g kg^-1, Low 0.01, Interval 0.5), and Convergence (1x10^-5 s^-1,Low -500, High -100; -100x10^-5 s^-1 is the scale of convective convergence). Values are averaged across the cross section.
1100 27 Oct 10 CTRL MY A” A” A” A” B” B” B” B” WDM6 SBUYLIN Plots of Total precipitation mixing ratio (black,g kg^-1, Low 0.05, Interval 0.5), Total cloud mixing ratio (blue, g kg^-1, Low 0.01, Interval 0.5), and Convergence (1x10^-5 s^-1,Low -500, High -100; -100x10^-5 s^-1 is the scale of convective convergence). Values are averaged across the cross section.