Download
1 / 34
340 likes | 455 Views
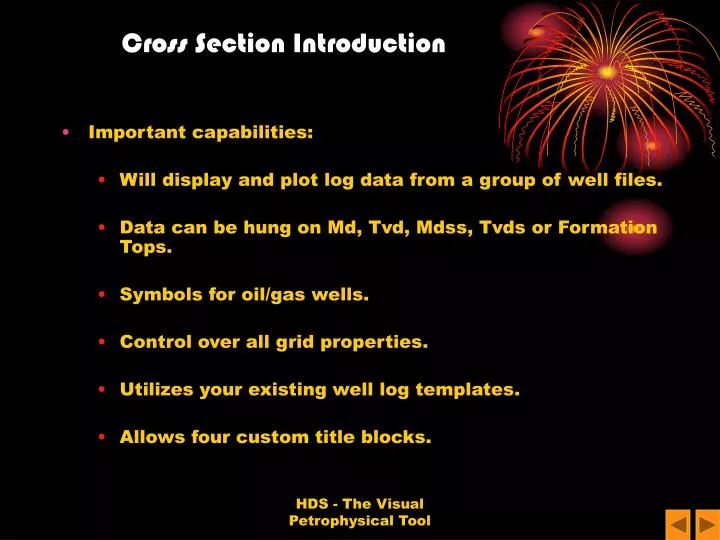
Cross Section Introduction. Important capabilities: Will display and plot log data from a group of well files. Data can be hung on Md, Tvd, Mdss, Tvds or Formation Tops. Symbols for oil/gas wells. Control over all grid properties. Utilizes your existing well log templates.

E N D
Cross Section Introduction • Important capabilities: • Will display and plot log data from a group of well files. • Data can be hung on Md, Tvd, Mdss, Tvds or Formation Tops. • Symbols for oil/gas wells. • Control over all grid properties. • Utilizes your existing well log templates. • Allows four custom title blocks. HDS - The Visual Petrophysical Tool
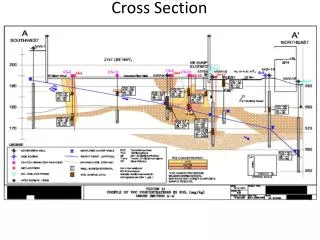
Typical Cross Section View HDS - The Visual Petrophysical Tool
Before you start a new project Cross Section Tutorial • Move All of your Well Files (*.MDB ) into a common directory using Microsoft Explorer • Make sure All Tops & Bases have matching Names. The names are not case sensitive HDS - The Visual Petrophysical Tool
Common Problems • Non-Matching Formation Names - that match from file to file are Extremely Important when designing for the top of a Formation to another. • When the program cannot make a match it draws to the end of the file giving some images that are 2 to 20 time longer than desired! These Formation names that do not match: • Lower Wilcox Sand A1 • Lower Wilcox Sand A-1 • Lower Wilcox Sd A1 • Lwr Wilcox Sand A1 HDS - The Visual Petrophysical Tool
Running the Cross Section Click the Cross Section Menu or Icon on the HDS Main Menu HDS - The Visual Petrophysical Tool
General Work Flow for New Projects Before Starting • Copy all files into a common directory • Review the Formation Names After starting the Cross Section • Select the files • Generate Well Images • Layout Setup • View Section HDS - The Visual Petrophysical Tool
Program Design HDS - The Visual Petrophysical Tool
Program Design The program is designed to work on the following tab structure from left to right. HDS - The Visual Petrophysical Tool
Step 1 - Selecting Files Select the Files you want by • Double clicking a file or • Range select the click add • Select 1 file then click add HDS - The Visual Petrophysical Tool
Create Well Images Step 2 – Create Well Images Tab This is used with every new project to determine the range of data to be plotted and the style of the track layout. The major items are in a tab structure near the bottom of this screen. HDS - The Visual Petrophysical Tool
Create Well Images Components Major Components for Setting up new sections • Plot Range • Size Properties • Picture Formatting • Generated Metafiles HDS - The Visual Petrophysical Tool
Create Well Images Plot Range Important Steps Select Formations Options button Select top Formation less extra footage Select Last Formation Select “Though Zone” (ie base) or “To Zone” (ie top). This can be important is not all tops and bases are entered. Add extra footage above top formation and below last formation. HDS - The Visual Petrophysical Tool
Create Well Images Size Properties Important Steps Select Depth Reference (ie MD, MDSS etc) Select Vertical Depth Range Image Width (normally 3-5 inches). Remember this value is multiplied by the number of wells then adds space left and right of each well. This will help populate missing TVD data if needed to match TVD & MD sectioning. HDS - The Visual Petrophysical Tool
Create Well Images Picture Formatting Important Steps Log Plot Format Name is need to create metafiles for viewing. Press this button to view the formats available to you. If this yellow box is empty your metafiles images will not be created. If you need to refine your format, then goto the Log Plots, setup your picture and save it as a User Defined Format. HDS - The Visual Petrophysical Tool
Create Well Images - Picture Formatting - Log Format & Setup This Screen selects any User Defined “Log Plot” for your files within the cross section. HDS - The Visual Petrophysical Tool
Create Well Images Generated Metafiles Important Steps Your default data path will be used unless changed. Use this button to scroll through the images save in the selected directory. HDS - The Visual Petrophysical Tool
Create Well Images – Generated Metafiles –Finanl Step New files will not be generated until clicking the button below. Very Important HDS - The Visual Petrophysical Tool
Layout Setup Step 3 – Layout Setup Tab • This setup is optional before going to the “View Section” tab (Step 4). • The spread sheet items must be setup on the screen. • Items on the tab structure below are interactive on “View Section” using a right click on the object for the menus. HDS - The Visual Petrophysical Tool
Layout Setup Title Block Optional Steps • Click which option button you want. • Type in the text using <Enter> for more lines. • Set borders and colors • Placement can be done via numbers or dragged on the View Section HDS - The Visual Petrophysical Tool
Layout Setup Posted Well Names Optional Steps • Set Borders • Set Fore and Back colors. • Align Text HDS - The Visual Petrophysical Tool
Layout Setup Directional Markers Optional Steps • Used to place labels such as NE & SW on your plot. • Set Borders • Set Fore and Back colors. • Align Text HDS - The Visual Petrophysical Tool
Layout Setup Datum Line & Depth Tracks Optional Depth Tracks Optional Datum Line • Show depth on the left or right side of your plot. • Spacing or frequency of lines. • Set line width. • Enter Depth for line. • Toggle visibility • Show depth text between wells HDS - The Visual Petrophysical Tool
Layout Setup Formation Names Names placed on Wells Names at Plot Sides • Line Width • Fore Color • Customize text within each formation name • Show on left side. • Show on right side. • Set Font • Set Color HDS - The Visual Petrophysical Tool
View Section Step 3 – View Section Tab The menu is interactive with areas of the plot by performing a right click with your mouse. • The line connecting “Layout Setup” on the menu can be accessed by right clicking your mouse in any white area outside of a well image that is not a part of another object • The line connecting “View Section Tools” on the menu can be accessed by right clicking your mouse in any well image. HDS - The Visual Petrophysical Tool
View Section Drop down Menus View Section Tools menus from right click inside the well images. Layout Setup menus from right click outside the well images. HDS - The Visual Petrophysical Tool
View Section Toolbars Group 2 of the toolbar • Select all wells • Deselect all wells • Show the Master Formation List for all of the wells Group 3 of the toolbar • Zoom In (smaller) • Zoom Out • Zoom Normalize (100%) Zoom Factor via Text or Slider Group 1 of the toolbar • Open file • Save project • Export to bitmap • Export to meatfile • Print • Exit Green bars on the ruler indicate a well below this spot with the length shown in green. HDS - The Visual Petrophysical Tool
View Section Steps • First zoom your data as desired. • Right-click in any image for the View Section Tools menu. • Select Formation (or depth). • Next use the formation popup list for the alignment. • Use Ctrl-T or menu to Connect Tops • Also you might want to set Horizontal Spacing from this • menu HDS - The Visual Petrophysical Tool
View Section Steps Presentation • Right-click for Layout Setup menu • Select Main Title Blocks, Top Title and caption • A input box with flashing cursor will appear • Input text and new lines with the <Enter> for as much data as you wish • Hit <Esc> or click off the input area and it will appear on the plot as an object • Use the 4-direction arrow to place the title on your plot or you can auto position, change colors and add borders HDS - The Visual Petrophysical Tool
View Section – Steps Presentation cont’d • This top title as had fore color, back color and font size changed as just discussed. • Now use the same method to add Map Direction Markers. Right Click here. HDS - The Visual Petrophysical Tool
View Section – Steps Presentation cont’d • Right-click for Layout Setup menu to adjust Formation: • Line Width • Fore Color • Font properties HDS - The Visual Petrophysical Tool
View Section Printing Select Printer Print at your current zoomed dimensions or full size Proceed with printing HDS - The Visual Petrophysical Tool
View Section Pick Formations From Logs Under construction HDS - The Visual Petrophysical Tool
Working Relationship • HDS maintains a strong working relationship with our customers by: • Implementing yours ideas in the software. • Assisting in Problem Solving. • Software Support Services. • Petrophysical Services. HDS - The Visual Petrophysical Tool
Contact Us • An evaluation copy of the product is available upon request. During you review you will receive complete program support service. For more information please contact: Hydrocarbon Data Systems, Inc. P.O. Box 41508 Houston, TX 77241 USA Phone 713-690-0556 Fax 713-690-0558 Email: hds@hds-log.com Web Page: www.hds-log.com Energy Technology Limited P.O. Box 218 Warwick, Warwickshire CV34 4LN UK Phone 44-1926-402-800 Email: alex@oakcon.demon.co.uk Web Page: www.hds-log.com HDS - The Visual Petrophysical Tool