Download

1 / 6
60 likes | 76 Views
The most immediate way to use the transition matrix is to make wagers based on the last drawing. <br>Visit here https://www.thelotterylab.com/transition-matrix-tool

E N D
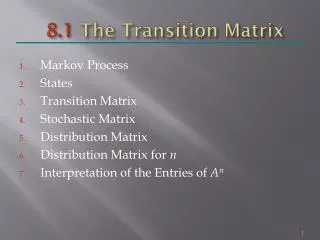
What is a transition matrix tool? The transition matrix is a tool for detecting patterns in the sequence of numbers drawn from a lottery machine. It is a variation on frequency analysis which considers the ball drawn immediately before the current ball. One key lottery assumption is that any drawing is independent of the previous drawing. However, even major lottery commissions seem suspicious of this assumption. For example, the Texas state lottery commission conducts “pre-test” drawings immediately before official drawings. The stated purpose of these tests it to perform a version of a frequency analysis, but it is notable that this “pre-test” prevents players from applying a transition analysis approach.
How Its Works As in other examples, we consider data from Missouri’s Pick4. Although there is a total of four machines in this lottery, we are focused on the first one. Since the Pick4 is a “numbers game” or “digit game”, each machine has ten balls numbered from 0-9 and only one ball is selected in each drawing. Before we discuss the principles behind the transition matrix and how we might apply it to detect patterns, lets focus on how to read the matrix.First, notice that we have the numbers 0-9 along the horizontal and vertical axis. These represent the balls in the machine. The vertical axis represents the ball drawn in the immediate previous drawing. The horizontal axis represents the ball drawn in the current drawing. The value in each cell indicates the probability of drawing the horizontal value given that the last ball was on the vertical. For example, when ball 4 was drawn, ball 1 has been drawn next 2.7% of the time.
Similar to frequency analysis, we calculate the observed frequency of transitioning from one ball to another by counting the number of times that the transition has occurred and dividing by the number of times that the first ball in the pair was drawn. An important point is that the number we are dividing by is different for each row. This complicates our ability to apply frequency analysis directly to a transition matrix, so we simply color transitions which are more frequent that expected green and transitions which are less frequent as red. In this situation the expected probability is 10%. The most immediate way to use the transition matrix is to make wagers based on the last drawing. For example, if ball 4 had been drawn from Machine 1 one might pick ball 6 for the next drawing because this transition has occurred 21.62% of the time.
The Lottery Lab Website: https://www.thelotterylab.com