Download
1 / 27
340 likes | 550 Views
Modelling the Nutritional Implications of Thermal Stress. Food Futures Flagship. Dr Brett Glencross CSIRO Australia Project Leader – ACIAR FIS-2006-141. Heat Stress.

E N D
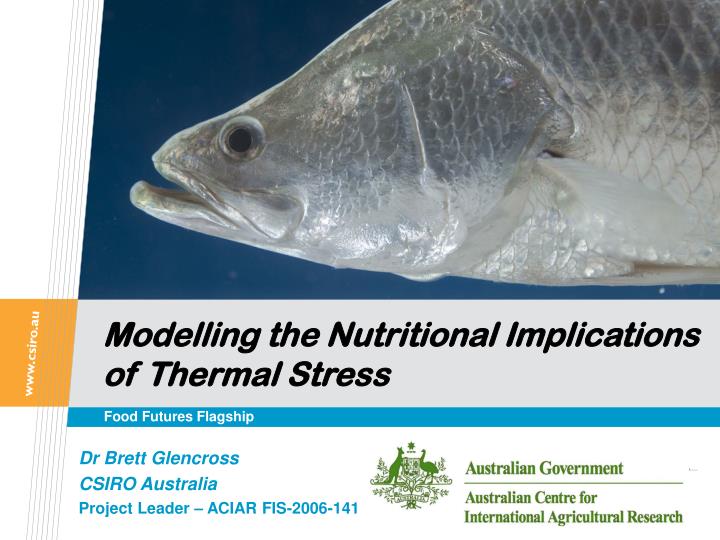
Modelling the Nutritional Implications of Thermal Stress Food Futures Flagship Dr Brett Glencross CSIRO Australia Project Leader – ACIAR FIS-2006-141
Heat Stress Bermudes, M., Glencross, B.D., Austen, K., Hawkins, W., 2010. Effect of high water temperatures on nutrient and energy retention in barramundi (Lates calcarifer). Aquaculture 306, 160-166.
Clinical Indicators – Blood Markers • High temperatures result in… • Elevated CK and LDH, indicating muscle degradation. • ALAT and GLDH elevation, indicating liver damage. • ALAT and GLDH also indicate increases in amino acid catabolism Glencross, B.D, Rutherford, N.R. 2010. Dietary strategies to reduce the impact of temperature stress on barramundi (Lates calcarifer) growth. Aquaculture Nutrition 16, 343-350.
What is bioenergetic modeling ? Energy Demand (kJ/fish/d) = M • Liveweight b + G • EnergyGain Growth Demands Maintenance Demands A thermally dependent coefficeint Allometric exponent Based on energy density (kJ) of fish growth Conversion efficiency Fish weight (kg)
Three-dimensional data array Growth Demands Growth rate (g/d) Temperature (ºC) Fish weight (g/fish)
Defining growth potential Growth Demands Glencross, B.D., 2008. A factorial growth and feed utilisation model for barramundi, Lates calcarifer based on Australian production conditions. Aquaculture Nutrition 14, 360-373.
Defining growth composition Growth Demands Fish live-weight (g/fish)
Building a bioenergetic model Growth Demands Maintenance Demands 2. Protein and Energy Gain Through Varying Intake 1. Protein and Energy Losses Through Starvation
Energy Loss Coefficients Energy Loss Exponents Size Temperature Energy losses with temperature Maintenance Demands Losses at 26ºC Glencross, B.D., Bermudes, M., (2011). Effect of high water temperatures on energetic allometric scaling in barramundi (Lates calcarifer). Comparative Biochemistry and Physiology – Part A 159, 167-174.
Energy utilisation with temperature Growth Demands Maintenance Demands Utilisation at 29ºC Intake at maintenance (HEm) = intake @ 0 kJ gain Needs 1 / 0.576 energy = 1.74 x energy demand Glencross, B.D., Bermudes, M., (2011a). Effect of high water temperatures on the utilisation efficiencies of energy and protein by juvenile barramundi, Lates calcarifer. Fisheries and Aquaculture Journal – FAJ14, 1-11.
Utilisation with temperature Maintenance Demands Growth Demands Maintenance Energy (kJ/MBW/d) Energy Utilisation Coefficient Protein Utilisation Coefficient Maintenance Protein (g/PBW/d) Glencross, B.D., Bermudes, M., (2011a). Effect of high water temperatures on the utilisation efficiencies of energy and protein by juvenile barramundi, Lates calcarifer. Fisheries and Aquaculture Journal – FAJ14, 1-11.
Defining maintenance energy demands Maintenance Demands Glencross, B.D., Bermudes, M., (2011). Adapting to climate change: Using a bioenergetic modelling approach to understand the implications of heat stress on barramundi (Lates calcarifer) growth, feed utilisation and optimal protein and energy requirements. Aquaculture Nutrition. IN PRESS
Integrating the Energy Demand a x1.6 b = a + b Glencross, B.D., Bermudes, M., (2011). Adapting to climate change: Using a bioenergetic modelling approach to understand the implications of heat stress on barramundi (Lates calcarifer) growth, feed utilisation and optimal protein and energy requirements. Aquaculture Nutrition. IN PRESS
Reverse Designing Diets Energy Demand Feed Energy Density (e.g. 19 kJ/g) (e.g. 38 kJ/d) Feed Ration Required (e.g. 2 g/d) Daily Protein Demand Feed Protein Density (e.g. 1.0 g/d) (e.g. 1g / 2g =50%)
Redefining protein and energy demands Glencross, B.D., Bermudes, M., (2011). Adapting to climate change: Using a bioenergetic modelling approach to understand the implications of heat stress on barramundi (Lates calcarifer) growth, feed utilisation and optimal protein and energy requirements. Aquaculture Nutrition. IN PRESS
Dietary Strategies for Heat Stress So if thermal stress increases DP:DE demands we should be able to mitigate problems by using higher protein lower lipid diets ? Simple Experiment ?
Dietary Strategies for Heat Stress Pro = 60% protein, 14% lipid Ref = 50% protein, 18% lipid a a • Poorer growth at high temperatures can alleviated by… • Higher protein : energy ratio • Feed efficiency (FCR) changes more with lower protein Glencross, B.D, Rutherford, N.R. 2010. Dietary strategies to reduce the impact of temperature stress on barramundi (Lates calcarifer) growth. Aquaculture Nutrition 16, 343-350.
Clinical Indicators – Blood Chemistry Pro = 60% protein, 14% lipid Ref = 50% protein, 18% lipid • High temperatures result in… • Elevated CK and LDH, indicating muscle degradation. • ALAT and GDH elevation, indicating liver damage. Glencross, B.D, Rutherford, N.R. 2010. Dietary strategies to reduce the impact of temperature stress on barramundi (Lates calcarifer) growth. Aquaculture Nutrition 16, 343-350.
High Temperature Diets Summary • Optimal growth of barramundi between 29ºC and 32ºC • High water temperatures cause a breakdown in the animals ability to effectively use protein • Increased rate of protein losses • Reduction in utilisation efficiency • The bigger the fish the more susceptible they are • At high water temperatures there are potential dietary strategies of benefit: • Increasing the DP:DE ratio helps maintain performance at 37ºC relative to that at 30ºC • Use of sub-clinical measures, such as plasma enzymes, shows that at 37ºC there is the onset of both muscle and liver damage occurring
What this means for diet specifications 30ºC 35ºC Assumes crude values based on earlier ADC values for each temperature
Digestibility with Temperature Water Temperature (ºC) Bermudes, M., Glencross, B.D., Austen, K., Hawkins, W., 2010. Effect of high water temperatures on nutrient and energy retention in barramundi (Lates calcarifer). Aquaculture 306, 160-166.
Protein Loss with Starvation Glencross, B.D., Bermudes, M., (2011). Effect of high water temperatures on energetic allometric scaling in barramundi (Lates calcarifer). Comparative Biochemistry and Physiology – Part A. doi:10.1016/j.cbpa.2011.02.13.
Protein Utilisation with Temperature Utilisation at 29ºC Intake at Maintenance Protein = intake @ 0 protein gain Needs 1 / 0.493 protein = 2.0 x protein demand Glencross, B.D., Bermudes, M., (2011a). Effect of high water temperatures on the utilisation efficiencies of energy and protein by juvenile barramundi, Lates calcarifer. Fisheries and Aquaculture Journal. IN PRESS
Protein Utilisation with Temperature Utilisation Coefficient Maintenance Demand (kJ/MBW/d) Glencross, B.D., Bermudes, M., (2011a). Effect of high water temperatures on the utilisation efficiencies of energy and protein by juvenile barramundi, Lates calcarifer. Fisheries and Aquaculture Journal. IN PRESS
Integrating the Protein Demand a x 2.1 b = a + b