Download
1 / 20
220 likes | 467 Views
Global Solar Radiation Maps of Saudi Arabia. M. Mohandes and S. Rehman King Fahd University of Petroleum and Minerals Dhahran-31261, Saudi Arabia. Outlines. Introduction Objectives Data Collection Stations Methodology Results Conclusions. Introduction.

E N D
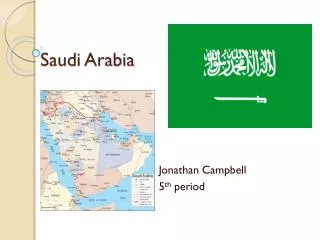
Global Solar Radiation Maps of Saudi Arabia M. Mohandes and S. Rehman King Fahd University of Petroleum and Minerals Dhahran-31261, Saudi Arabia
Outlines • Introduction • Objectives • Data Collection Stations • Methodology • Results • Conclusions
Introduction • Detailed knowledge of global solar radiation (GSR) is critical for the development of solar applications • In developing countries, not enough GSR recording stations exist due to high cost and lack of expertise • There are 35 solar radiation data collection stations spread throughout KSA • GSR values are estimated to draw contour maps of GSR
Objectives • Predict GSR in any location in KSA based on sunshine duration, month number, latitude, longitude, and altitude • Draw the contour map of GSR
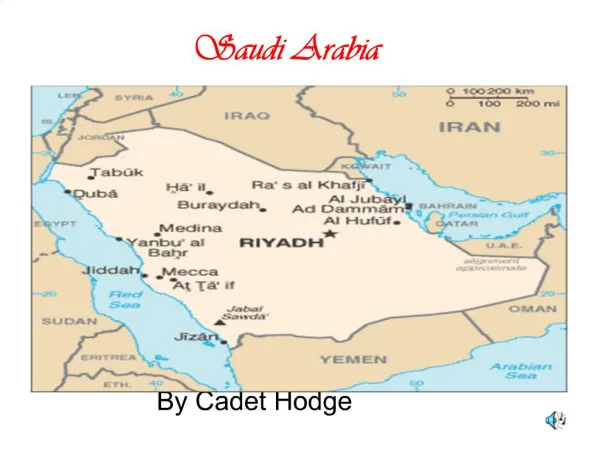
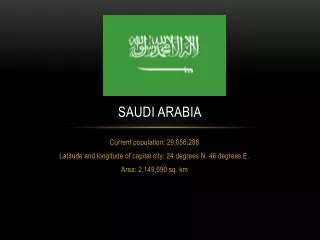
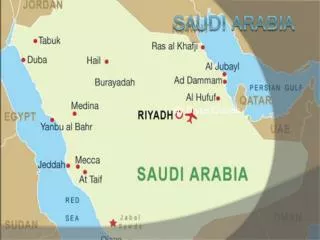
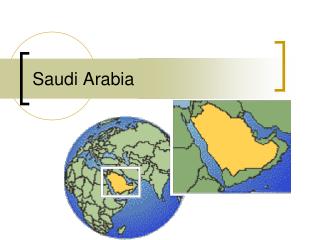
Data Description • Saudi Arabian land consists of desert and semi-desert with oases • Half of the total surface is uninhabitable desert. • Major part of the western area is plateau while the east is lowland with hot climate • The southwest region has mountains as high as 3000 meters • One of the driest and hottest countries in the world
Data Description • Located between lat 31N and 17.5N and long 50E and 36.6E • Mainly two seasons: winter and summer • Maximum summer temperatures often exceed 45ºC, RH is very low and skies are mostly clear • The vast open land experiences high intensities of GSR and long hours of SSD • GSR and SSD is being recorded in KSA since 1970
Methodology • Abductory Induction Mechanism (AIM) Networks is used in to estimate the GSR • AIM uses mathematical models to represent complex and uncertain relationships along with polynomial networks to find the underlying process • The nodes of a typical feed-forward AIM network can be Singles, Doubles, and Triples which are third order polynomials with one, two or three inputs respectively
Methodology • A Double is defined as the following equation: Output = w0 + w1x1+ w2x2 + w3x12 + w4x22 + w5x1x2 + w6x13 + w7x23 Where x1 and x2 are inputs and wnare the obtained weights after training • AIM simplifies model development and reduces the learning or development time and effort by automatically determining the optimum model characterized by network size, element types, connectivity, and coefficients • It is accomplished by performing a trade-off between model complexity and accuracy
Results • Leave-one-out method is used to estimate the performance of the system on locations with unknown GSR value. • Data from 34 locations is used to estimate the GSR value at the remaining location based on SSD, month number, latitude, longitude, and altitude of the location. • The process is repeated for all other locations. • The mean absolute percent error (MAPE) estimate for the 35 locations ranges between 2% and 18% with an overall average of 9%.
Results • Finally, the data from the 35 locations are used to train an abductive network to estimate the GSR values anywhere in the Kingdom and in any month of the year based on the input values defined above. • GSR values are estimated at 25 additional locations and are used with the measured data to draw comprehensive contour maps • Similar maps can be developed for any month of the year using the same trained network
Conclusions • Results indicate good agreement between measured and predicted GSR values for each of these 35 locations. • The method is validated on locations with known GSR values and found to give values very close to the measured ones. • The estimated values using the developed method along with the measured values from the 35 measurement stations were used to draw the GSR maps