Download
1 / 15
150 likes | 273 Views
Member Institutions. The Scalable Data M anagement , Analysis, and Visualization (SDAV) Institute 2012-2017. Laboratories ANL LBNL LLNL ORNL LANL SNL Kitware (Industry). Universities Georgia Tech NCSU NWU OSU UCD Rutgers UUtah. Hank Childs , LBNL

E N D
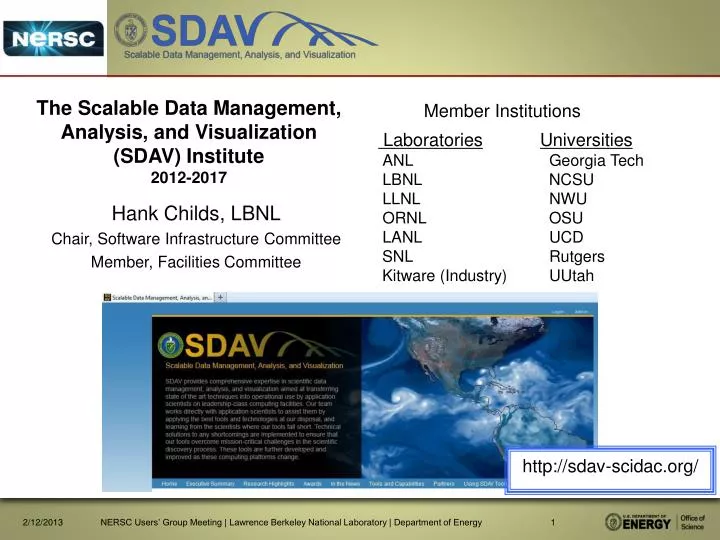
Member Institutions The Scalable Data Management,Analysis, and Visualization(SDAV) Institute2012-2017 Laboratories ANL LBNL LLNL ORNL LANL SNL Kitware (Industry) Universities Georgia Tech NCSU NWU OSU UCD Rutgers UUtah Hank Childs, LBNL Chair, Software Infrastructure Committee Member, Facilities Committee • http://sdav-scidac.org/ NERSC Users’ Group Meeting | Lawrence Berkeley National Laboratory | Department of Energy
The purpose of this presentation is to connect NERSC Users with SDAV personnel. This is a critical part of the SDAV mission. NERSC Users’ Group Meeting | Lawrence Berkeley National Laboratory | Department of Energy
SDAV Constituents and Goals • Constituents: • SciDAC (1, 2) Scientific Data Management Center (Shoshani) • SciDAC (2) Visualization and Analytics Center for Enabling Technologies (Bethel) • SciDAC (2) Institute for UltrascaleSciDAC Visualization (Ma) • New: LANL, Kitware, … • The Goals of SDAV Are: • to actively work with application teams to assist them in achieving breakthrough science • to provide technical solutions in the data management, analysis, and visualization regimes that are broadly used by the computational science community • What We Offer: • ongoing relationships with science teams, technologies, expertise Computational Research Division | Lawrence Berkeley National Laboratory | Department of Energy
SDAV Organization Computational Research Division | Lawrence Berkeley National Laboratory | Department of Energy
The SDAV institutetools Data Management tools Data Analysis tools Visualization tools • Frameworks for In Situ Processing • ADIOS (ORNL) • Glean (ANL) • In situ code coupling and data streaming • Data Spaces (Rutgers) • FlexPath (Gtech) • Indexing • FastBit (LBNL) • In Situ Data Compression • ISABELLA (NCSU) • Parallel I/O and File Formats • PnetCDF, BP-files, HDF5 • I/O monitoring • Darshan (ANL) • Statistical and Data Mining Techniques • NU-Minebench (NWU) • Importance-Driven Analysis Techniques (UCD, Utah) • Domain-Knowledge Directed • Geometry Based • Topological Methods (UCD, Utah, LBNL) • In Situ Topology (Topologika) • Feature-Based Analysis • High-Dimensional Analysis • Parallel visualization • Visit (LBNL, SNL, LLNL) • ParaView (LANL) • VTK-m framework (Kitware) • Specialized Vis techniques(UCD, Utah, LBNL, OSU) • Flow Visualization Methods • Rendering • Ensembles, Uncertainty, and Higher-Dimensional Methods Computational Research Division | Lawrence Berkeley National Laboratory | Department of Energy
Adaptable I/O System • An I/O abstraction framework • Provides portable, fast, scalable, easy-to-use, metadata rich output with a simple API • Layered software architecture: • Change I/O method on-the-fly • Aggregation methods, HDF5, Netcdf-4, Posix, MPI-IO • Abstracts the API from the method used for I/O • http://www.nccs.gov/user-support/center-projects/adios/
What else can be done when capturing I/O • Real-time monitoring on a Dashboard (ORNL) • Time-step data is captured and processed by a workflow system • Images/graphs generated by a workflow Code coupling with DataSpaces (Rutgers) • Virtual shared space • Constructed on-the-fly on staging nodes • Indexes data for quick access and retrieval • Provides asynchronous coordination and interaction and realizes the shared-space abstraction • In-space (online) data transformation and manipulations • Decentralized data analysis in-the-space • Imbed FastBit indexing to find regions of interest (LBNL) • Set of regions with high electromagnetic potential in a torus modeled by GTC • Achieved speed up of 500-900 fold on magnetic coordinates Contact: Scott Klasky Computational Research Division | Lawrence Berkeley National Laboratory | Department of Energy
VTK: The Visualization ToolKit • Open source, freely available software for 3D computer graphics, image processing, and visualization • Managed by Kitware Inc. • Use C++, Tcl/Tk, Python, Java Computational Research Division | Lawrence Berkeley National Laboratory | Department of Energy
ParaView: end-user tool for parallel visualization and analysis Organizations: • ParaView provides: • Client-server computing • State management • Python modules • Application/GUI framework • ParaView framework can be used to develop other applications • ParaView can be embedded in other application and frameworks Computational Research Division | Lawrence Berkeley National Laboratory | Department of Energy
VisIt is an open source, richly featured, turn-key application for large data. • For data exploration, quantitative analysis, communication, debugging, & more. • 1.5M lines of code • ~15 active developers • Popular • R&D 100 award in 2005 • Used on many of the Top500 • >200K downloads • Funded by DOE/NNSA, DOE/NE, DOE/ASCR, NSF/XSEDE, & more 1 billion grid points / time slice 217 pin reactor cooling simulation Run on ¼ of Argonne BG/P Image credit: Paul Fischer, ANL
PISTON: A Portable Cross-Platform Framework for Data-Parallel Visualization Operators Goal: Portability and performance for visualization and analysis operators on current and next- generation supercomputers Main idea: Write operators using only data-parallel primitives (scan, reduce, etc.) Requires architecture-specific optimizations for only for the small set of primitives PISTON is built on top of NVIDIA’s Thrust library We have run visualization algorithms on GPUs and on multi-core CPUs using the exact same operator code by compiling to CUDA and to OpenMPbackends Isosurface and cut plane operators Curvilinear coordinates Halo finder using KD-tree
EAVL: Extreme-scale Analysis and Visualization Library Targets approaching hardware/software ecosystem: • Update traditional data model to handle modern simulation codes and a wider range of data. • Investigate how an updated data and execution model can achieve the necessary computational, I/O, and memory efficiency. • Explore methods for visualization algorithm developers to achieve these efficiency gains and better support exascale architectures. http://ft.ornl.gov/eavl
TOPOLOGIKA: in situ analysis • TOPOLOGIKA: Time-Varying Data Analysis with Time Activity Curves (U Utah) • Fast parallel evaluation of dependent statistics • Compute graph abstractions for multi-resolution feature representation • Computer graph models of concurrent tracking of features at multiple scales Result/Impact • Orders of magnitude in data reduction from raw data to unrestricted feature space • Orders of magnitudes speedup reducing batch jobs into interactive processing • Enable scientists to explore the feature space interactively Topological model (left) representing multiple possible nested features of interest (right). Computational Research Division | Lawrence Berkeley National Laboratory | Department of Energy
SDAV Summary • Many of the tools in the SDAV institute have been developed over many years and are robust and well-documented • Some of the tools have been designed to take advantage of high level parallelism • Such tools have been used for multiple scientific domains, but often require collaboration between application scientists and tool experts; that is the role of SDAV • For anticipated future needs, tools are being enhanced in several ways: • Scale tools for high parallelization levels • Adapt tools to take advantage of new hybrid hardware (CPUs + GPUs), and hybrid storage (disk and SSDs) • Adapt tools for in situ processing and analysis to provide early insight of the generated data • Compress and index data in situ for both in situ and post-processing analysis • SDAV is highly productive: over 70 publications since March 2012 Computational Research Division | Lawrence Berkeley National Laboratory | Department of Energy
Please contact me if you would like assistance from SDAV in doing data management, analysis, and/or visualization on NERSC systems! Hank Childs (hchilds@lbl.gov) NERSC Users’ Group Meeting | Lawrence Berkeley National Laboratory | Department of Energy