Download
1 / 19
250 likes | 777 Views
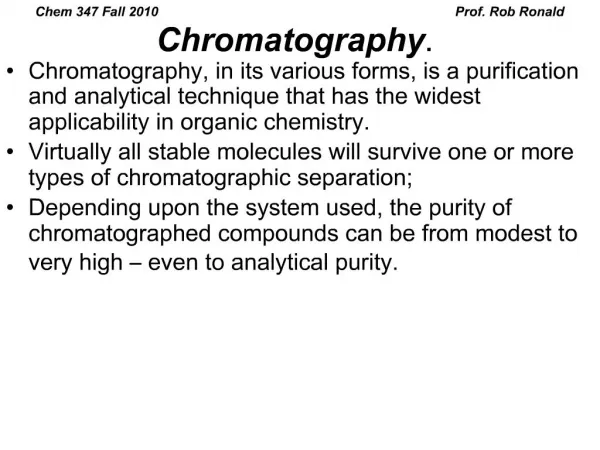
Bio process lab. Elution Chromatography. Kinetic Analysis and Scaling up. Bio process lab. Contents. Kinetic Analysis Introduction A quantitative approximation Example Scaling up Chromatography Changes in the standard deviation Scaling up the separation Example.

E N D
Bio process lab. Elution Chromatography Kinetic Analysis and Scaling up
Bio process lab. Contents • Kinetic Analysis • Introduction • A quantitative approximation • Example • Scaling up Chromatography • Changes in the standard deviation • Scaling up the separation • Example
1. Starting onditions 2. Adsorptionof sample substances 3. Start of desorption 4. End of desorption 5. Regeneration + + + + + + + + + + + + + + + 1 2 3 4 5 Bio process lab. Kinetic Analysis • Introduction • The column contains equilibrium stages • The concentration profile is the result of diffusion and chemical reaction • The actual diffusion and chemical reaction between solute and packing(5 step)
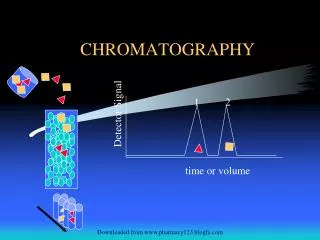
Inlet t or V Outlet - Plug Flow without Dispersion No adsorption fast adsorption Slow adsorption Outlet - Flow with Dispersion fast adsorption Slow adsorption Bio process lab. • To see the effects of diffusion and reaction, a solute pulse fed into a packed column Figure 1. Modeling elution chromatography with rate processes
Bio process lab. Mass balance equation - initial condition • A quantitative approximation t = 0, z = 0 , all z , - to solve these equation • if mass transfer is controlling y, q = concentration of the solutes in mobile and stationary phase z = column length t = time v = linear velicity of the mobile phase = void fraction E = apparent axial dispersion coefficient K = mass transfer coefficient a = packing area per bed volume y* = concentration in solution at equilibrium
Bio process lab. • if diffusion within pores is rate • controlling Number of transfer units(NTU) Height of a transfer unit(HTU) D = effective diffusion coefficient t’ = some characteristic time • if reversible chemical reaction is • rate controlling k, k’ = forward and reverse rate constants of this reaction
Bio process lab. The concentration at the peak The result
Bio process lab. • Aspartame Isomer Separation • Example Peak Time t0 (min) column length : 25cm diameter : 0.41cm particle diameter : 45×10-4cm particle volume fraction : 0.62 Peak Spread t0 (min) d aspartame l aspartame 62 71 3 6 Problem : Find the apparent rate constant k for this separation and compare these rate constants with those expected from the mass transfer correlation d : packing diameter : solvent velocity : kinematic viscosity D : diffusion coefficient 0.7×10⁻⁵ cm2/sec
Bio process lab. Solution The velocity under the conditions given For the d aspartame Therefore Peak spread 3 min, a = 6(1-)/d for the d aspartame NTU = 427 for the l aspartame, NTU = 140 for the l aspartame, k = 1.7×10⁻³cm /sec
Bio process lab. The values for the mass transfer coefficient • The Effects of Axial Dispersion Problem : For slow (laminar) flow in a long thin tube, the concentration profile of a pulse injected at t = 0 and z = 0 is given by Find NTU expression E : dispersion coefficient, E=2d2/192D D : solute’s diffusion coefficient : velocity, t : time z : tube length, z = l = t0 d : diameter
Bio process lab. Solution rewriting z = l = t0 Using the expression for E
Bio process lab. Scaling up • Introduction • At the larger scale, we want a bigger capacity but with the same yield and purity • To increase the capacity, we are able to increase the solute concentration in the feed and the flow through the column • parameter : y0, V/V0,
Bio process lab. • it is a function of the velocity, column • length, rate constant • d : sphere’s diameter • Changes in the standard deviation rate constant k : - solute와packing사이의 상호작용이 지배되는 단계에서 변화 - if the controlling step by diffusion and fast reaction within the particles - if the controlling step by mass transfer between the bulk and the particle • it may also change because of dispersion
Bio process lab. Table 1. Changes in the Standard Deviation Controlling step The quantity 2 is Proportional to Remarks Probably the most common case Supported by the most complete analysis Likely to become more important at large scale Rarely important Assumes the number of stages N is proportional to the length Internal diffusion and reaction External mass transfer External(Taylor) dispersion Axial diffusion Column of actual equilibrium stages
Bio process lab. • Keep the ratio of packing diameter to column diameter • preserve the character of the flow in the packed bed • use larger, cheaper packing • Fix d and increase both and l at constant (/l ) • at this case, the pressure drop can increase dramatically • because of small constant d, the pressure drop is already high • use short fat columns • and l used in the small scale separation • increased capacity is due to their greater cross sectional area • Scale up the separation
Bio process lab. • Fumarase Chromatography 10g of the enzyme fumarase are being purified in an ion exchange column. At a velocity of 30cm/hr, the peak in concentration exits the column in 93min and the standard deviation of this peak is given as 12min • Example (a) how long must we purify for a 90% yield Thus = 0.129, t = 115 min We must wait 115/93(-1.24) times longer then the peak time to get a 90% yield
Bio process lab. (b) If we in crease the flow to 60cm/hr, how long must we run for this same yield if the process is controlled by diffusion and reaction? (c) How long must we wait if the process is controlled by mass transfer If the process is controlled by mass transfer, t0= 46.5min from Table 1 t0 = 46.5mim 1/4 Thus Eq. (7.2-12) t = 59.4 min t = 61.8 min We must wait only 1.28 times the peak time for a 90% yield We must wait 61.8/46.5(=1.33) times the peak time to get a 90% yield
Peak Time t0 (min) t0 (min) Void voumne Transfferrin Salts 27 41 88 - 4 4 Bio process lab. (d) How long must we wait if Taylor dispersion controls? (e) How long must we wait if the column actually contains equilibrium stages If Taylor dispersion is rate controlling Thus = 0.129 1/2 The results are exactly the same as part(b) Thus t is 57.5min, 1.24 times the time for the peak • Transferrin Desalting A dilute feed in which 80% of the total solute is transferrin and 20 % behaves like sodium chloride is to be desalted on a dextran gel column. Operation the column at 10cm/hr gives the following results:
Bio process lab. Problem : What is the maximum velocity and the time which will give a 99% yield of thransferrin which is 98% pure Solution :