Download
1 / 16
160 likes | 293 Views
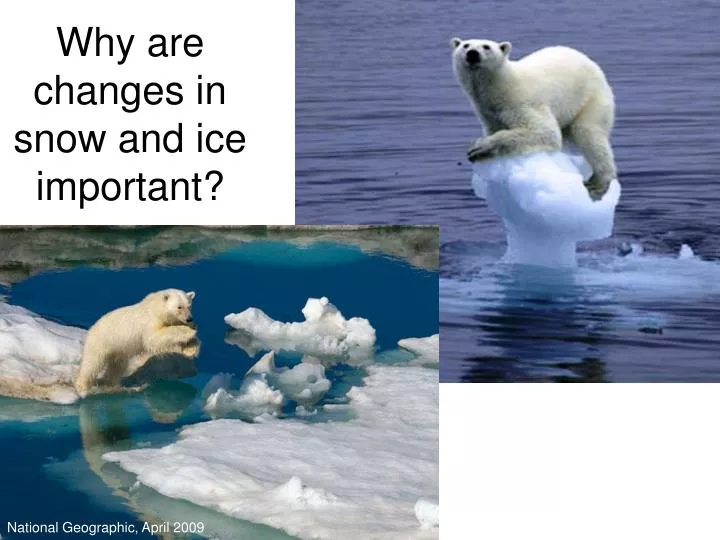
Why are changes in snow and ice important?. National Geographic, April 2009. August, 2011. Climate Change Indicators & Consequences of Climate Changes. Global National Geographic prediction of effects of 2 degrees of warming (2 min)

E N D
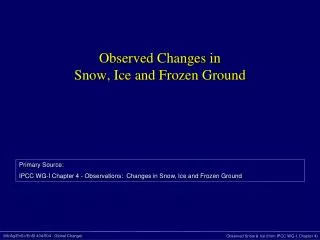
Why are changes in snow and ice important? National Geographic, April 2009
August, 2011 Climate Change Indicators & Consequences of Climate Changes • Global • National Geographic prediction of effects of 2 degrees of warming (2 min) • http://www.youtube.com/watch?v=P-0_gDXqYeQ&feature=channel • NASA Global Climate Indicators • http://climate.nasa.gov/keyIndicators/index.cfm#globalTemp • EPA Climate Indicators Report http://www.epa.gov/climatechange/ • Tour of the Cryosphere • Regional What aspects of our outdoor region do you value (recreation, aesthetics, other ecosystem services)? What have you experienced in terms of changes in these ecosystem services? Reading: www.epa.gov/climatechange/indicators.html (summary of key findings pp. 1-7, snow and ice pp. 44-51); Impacts of a Warming Arctic: Climate Impact Assessment (2004) http://amap.no/acia Exec. Summary pp. 8-20)
Variability in Snow and Ice Cameron, W., Indicators of Climate Change in the Northeast over the Past 100 Years, UNH Tour of the Cryospherehttp://svs.gsfc.nasa.gov/vis/a000000/a003300/a003355/a003355_480p_vo.mp4
http://nsidc.org/data/seaice_index/archives/index.html Example – Polar Sea Ice
http://nsidc.org/data/seaice_index/archives/index.html (connect as guest) http://nsidc.org/news/press/20101004_minimumpr.html Example – Polar Sea Ice
Sea Ice Concentration Video Break How is this data collected? NASA Big Planet Little Bear 1980 - 2010 September Arctic ice concentration images http://arctic.atmos.uiuc.edu/cryosphere/
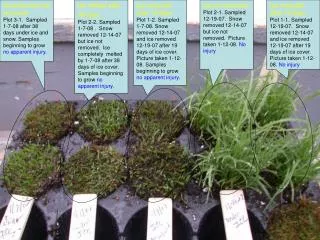
Exploring Correlations – Polar ice cap size and regional temperatures • Formulate a hypothesis regarding the temperatures that are most highly correlated to polar ice cap size. Consider: • Time of year • Location • Ocean vs. land surface temperatures • Use NASA & NOAA data to evaluate your hypothesis: • Sea ice coverage: March and September 1980-2009 • Land surface temperatures at several locations along 80.25° latitude (March and September monthly averages, 1930-2004) • Ocean surface temperatures at several locations along 78.8° latitude (March and September monthly averages, 1930-2004)
Hypothesis: In the month of March as the land temperature raises the polar ice cap size will decrease
Why does temperature change so much in the Arctic? • Positive feedback loops • Current extreme environment subject to greater change Morello, L. (2010) Sea Ice Accelerates Arctic Warming, Scientific American, April 30,2010
Resources for Additional Background Learning • National Snow and Ice Data Center, University of Colorado, Boulderhttp://nsidc.org/pubs/education_resources/ • Sea ice data and access to pictures http://nsidc.org/data/seaice/index.html • Animations of Arctic ice extent or concentration http://nsidc.org/sotc/sea_ice_animation.html (tool to create your own animations - http://nsidc.org/data/seaice_index/archives/image_select.html ) • Tour of the Cryosphere video (http://svs.gsfc.nasa.gov/vis/a000000/a003600/a003619 ) • The Cryosphere Today -http://arctic.atmos.uiuc.edu/cryosphere/ • Comparing Ice - Provides the ability to compare pictures of ice area from 1979 to present • National Geographic – • “Ice Paradise: The rich life of Svalbard, Norway’s Arctic archipelago, faces a creeping thaw.” • Feature Article –http://ngm.nationalgeographic.com/2009/04/svalbard/barcott-text • Photo gallery - http://ngm.nationalgeographic.com/2009/04/svalbard/nicklen-photography • Vanishing sea ice interactive map • http://ngm.nationalgeographic.com/2007/06/vanishing-sea-ice/sea-ice-interactive • U.S. EPA Climate Change Summaries - http://epa.gov/climatechange/effects/polarregions.html • Impacts of a Warming Arctic: Climate Impact Assessment (2004)http://amap.no/acia • Stroeve, J., Holland, M.M., Meier, W., Scambos, T., Serreze, M (2007) Arctic sea ice decline: Faster than forecast Geophysical Research Letters, 34(L09501), doi: 10.1029/2007GRL029703. • http://www.smithpa.demon.co.uk/GRL%20Arctic%20Ice.pdf • A 5 page paper that is an in depth analysis of declining Arctic ice in September.