Download
1 / 16
160 likes | 282 Views
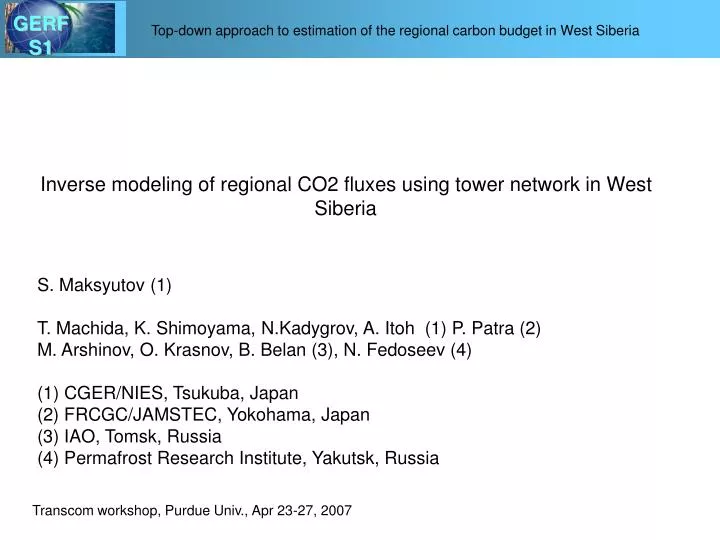
GERF S1. Top-down approach to estimation of the regional carbon budget in West Siberia. Inverse modeling of regional CO2 fluxes using tower network in West Siberia. S. Maksyutov (1) T. Machida, K. Shimoyama, N.Kadygrov, A. Itoh (1) P. Patra (2)

E N D
GERF S1 Top-down approach to estimation of the regional carbon budget in West Siberia Inverse modeling of regional CO2 fluxes using tower network in West Siberia • S. Maksyutov (1) • T. Machida, K. Shimoyama, N.Kadygrov, A. Itoh (1) P. Patra (2) • M. Arshinov, O. Krasnov, B. Belan (3), N. Fedoseev (4) • (1) CGER/NIES, Tsukuba, Japan • (2) FRCGC/JAMSTEC, Yokohama, Japan • IAO, Tomsk, Russia • Permafrost Research Institute, Yakutsk, Russia Transcom workshop, Purdue Univ., Apr 23-27, 2007
GERF S1 Top-down approach to estimation of the regional carbon budget in West Siberia • Method: Inverse model of the atmospheric CO2 transport is applied to constrain surface CO2 fluxes by the observed patterns of the atmospheric CO2 (with seasonal cycles) • Components: • Bottom-up estimate of C fluxes (long term), based on the terrestrial ecosystem NPP, respiration, biomass, biomass change. • Forward models: terrestrial ecosystem flux model (hourly to seasonal scale):coupled to atmospheric transport model. • Inverse model of atmospheric transport, finding optimal corrections to the surface fluxes
GERF S1 Top-down approach to estimation of the regional carbon budget in West Siberia • Q. (Back in 2002) Why do inverse modeling of carbon fluxes in West Siberia? • Established collaboration programs on atmospheric and ground based observations • Advantage for atmospheric transport modeling: simplified meteorology, flat terrain. • Scientifically interesting region: strong impact by climate change.
GERF S1 Top-down approach to estimation of the regional carbon budget in West Siberia Integrated vegetation map (1x1 km) based on GLC2000, forest inventory MODIS VCF vegetation continuous fields (500m) wetland typology map
GERF S1 Top-down approach to estimation of the regional carbon budget in West Siberia • Bottom-up estimate of C fluxes (long term), based on the terrestrial ecosystem NPP, respiration, biomass, biomass change. • Inventory of the carbon content and its long-term changes using field observations and forest survey data. • Forest inventory: provides observations of the wood stock (carbon stock) and annual change in forest area by category (felling, fire, etc) • Soil carbon stock inventory (by agricultural soil profile observations) • Wetlands (25% of the area, accumulators of peat deposits: need to know the area, and area fraction by landscape elements
Net Primary Production 800 700 I 600 II 500 III Carbon, g/m2/yr GERF S1 400 IV 300 V 200 Va 100 0 0 100 200 300 Age, Year Top-down approach to estimation of the regional carbon budget in West Siberia Empirical modeling of the forest carbon stock inventory and dynamics Forest state account (FSA): provides observations of the wood stock and annual change in forest area by category (felling, fire, etc), Frequency: reporting 1 year, full reporting 5 years, unit survey about 15 years FSA data for each unit: wood stock, area - by species, age class Input to empirical dynamic model Cedar (pinus sibirica) NPP by age and productivity class. Based on yield tables. FSA: regions and enterprises
GERF S1 Top-down approach to estimation of the regional carbon budget in West Siberia Problem: While forests and wetlands provide carbon sink, the agricultural lands show some loss of carbon 1. Comparison of the soil carbon surveys in recent 30 years indicates soil carbon loss to erosion. (Titlyanova et al) 2. Long term observations of the soil carbon after conversion to arable lands show stabilization of carbon content after ~50years. (Barsukov et al) soil map Siberian soil carbon profile database (Titlyanova et al)
GERF S1 Top-down approach to estimation of the regional carbon budget in West Siberia Airborne observations: air sampling and analysis Surgut 1993 - Yakutsk Novosibirsk
Noyabrsk Noyabrsk (NOY) (NOY) ( ( 63 63 26 26 ’ ’ N, 76 N, 76 46 46 E E ) ) o o o o ’ ’ 43m, 21m 43m, 21m Igrim Igrim (IGR) (IGR) GERF S1 Yakutsk Yakutsk ( ( 63 63 o o 12 12 ’ ’ N, 64 N, 64 o o 24 24 E E ) ) ’ ’ Igrim Igrim Noyabrsk Noyabrsk Zotino Zotino 47m, 24m 47m, 24m Demyanskoe Demyanskoe Parabel Parabel Vaganovo Beloretsk Berezorechka Berezorechka Working Azovo Azovo Savuushka Savuushka planned Demyanskoe Demyanskoe (DEM) (DEM) ( ( 59 59 o o 47 47 ’ ’ N, 70 N, 70 o o 52 52 E E ) ) ’ ’ Yakutsk Yakutsk (YAK) (YAK) 63m, 45m 63m, 45m ( ( 62 62 o o 50 50 ’ ’ N, 129 N, 129 o o 21 21 E E ) ) ’ ’ 70m, 11m 70m, 11m Parabel Parabel (PRB) (PRB) Berezorechka (BRZ) Berezorechka (BRZ) ( ( 58 58 o o 15 15 ’ ’ N, 82 N, 82 o o 24 24 E E ) ) ’ ’ ( ( 56 56 o o 09 09 ’ ’ N, 84 N, 84 o o 20 20 E E ) ) ’ ’ 67m, 35m 67m, 35m 80m, 40m, 20m, 5m 80m, 40m, 20m, 5m Top-down approach to estimation of the regional carbon budget in West Siberia OBSERVATIONS
GERF S1 Top-down approach to estimation of the regional carbon budget in West Siberia Observations: hourly data, -> selected afternoon data and fitted with Globalview type fits
Inverse modeling: monthly fluxes from 66 regions 66 region map (color map – by region number) 64 region map Inverse model used in this study is documented in: Patra, P.K., M. Ishizawa, S. Maksyutov, T. Nakazawa, and G. Inoue, (2005) Global Biogeochem. Cycles, 19, GB3005, doi:10.1029/2004GB002258.
Seasonal variation of CO2 Flux with 66 region inversion and 1 year (2005) of tower data Inderconstrained W.Siberia South (top), North (bottom) Central.Siberia South (bottom), North (top)
Seasonal variation of CO2 Flux with 66 region inversion and 1 year (2005) of tower data W.Siberia South (top), North (bottom) Central.Siberia South (bottom), North (top)
Seasonal variation of CO2 Flux with 66 region inversion and WITHOUT 1 year (2005) of tower data W.Siberia South (top), North (bottom) Central.Siberia South (bottom), North (top)
Seasonal variation of CO2 Flux, Comparison with another biospheric model (Simcycle) W.Siberia South (bottom), North (top) Central.Siberia South (bottom), North (top)
GERF S1 Top-down approach to estimation of the regional carbon budget in West Siberia • Summary and conclusions: • Tower observations in 2002-2006 were fitted using data filtering procedure (Nakazawa et al) at 5 W.S. sites to produce Globalview type fits. • Only daytime observations were used • Seasonal flux variability in well constrained regions shows same amplitude as CASA (prior) but earlier summer drawdown. • Seasonal variability in under-constrained ones is not that reasonable. • The inverted fluxes amplitude and seasonality look similar to those simulated by Simcycle – prognostic model, which may suggest that: • the inverse model fluxes are reasonable (biologically) • regional scale inverse model might be used as a tool to observe(!) regional scale seasonality of natural terrestrial carbon cycle


![[S1]](https://cdn2.slideserve.com/4310044/slide1-dt.jpg)