Download
1 / 2
20 likes | 103 Views
FIGURE S1. A. B. HIV-ve 37ºC. HIV+ve 37ºC. HIV+ve 4ºC Q-. HIV+ve 4ºC Q+. Cy5+. C. D. E. F. G.

E N D
FIGURE S1 A B HIV-ve 37ºC HIV+ve 37ºC HIV+ve 4ºC Q- HIV+ve 4ºC Q+ Cy5+ C D E F G
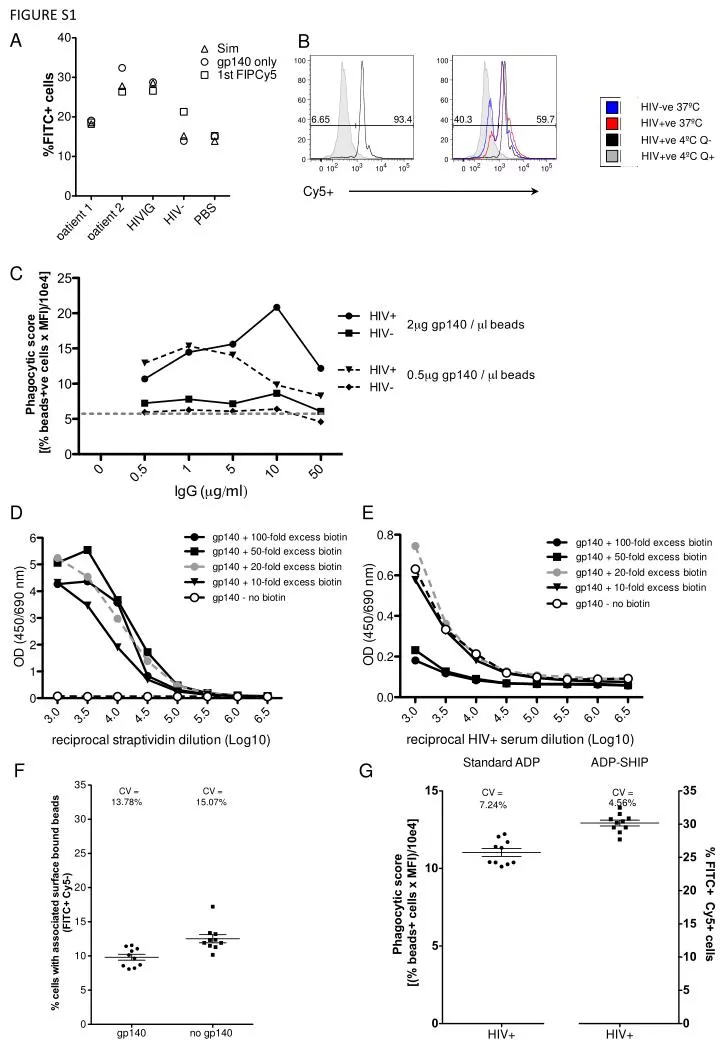
Figure S1: Efficient phagocytosis in both ADP assays is highly dependent on optimal HIV Env gp140 biotinylation and Env gp140 concentration and IgG concentration. (A) Comparing coating conditions of fluorescent beads were tested for both ADP assays. The beads were labelled using three different conditions (i) adding FIPcy5 and 0.75μg gp140 at the same time (sim), (ii) adding FIPcy5 first before adding 1.5μg gp140 (gp140 in excess), and (iii) adding 1.5 μg gp140 (gp140 in excess) only as a control. patient 1 and patient 2: IgG from two HIV+ individuals; HIVIG: pooled HIV human immunoglobulin; HIV-: IgG from a pool of HIV- subjects; PBS: no IgG added. (B) Gating for internalised and surface bound beads was established performing the assay at 4˚C (no phagocytosis; binding only) and 37˚C (phagocytosis) using HIV+ and HIV- IgG. Q+: QPC added; Q-: QPC not added. (C) Optimal gp140 and IgG concentration was determined using the standard ADP and gp140 (shown here for subtype A/E (966)). Grey line represents background detected for non-opsonised beads (without IgG). Biotinylation of gp140 was performed with 10 to 100 fold molar excess biotin based on the manufacture’s recommendations. (D) Optimal concentration of biotin for maximum biotinylation was determined by ELISA using streptavidin. (E) The degree of masking immunogenic epitopes on gp140 by attached biotin at varying levels of excess biotin was determined by using ELISA and pooled HIV+ serum. F) Levels of surface-associated beads in the presence and absence of gp140 coating of beads. Ten replicates were studied in the absence of sera and the co-efficient of variation (CV) is noted on the graph. G) Reproducibility of the standard ADP and ADP-SHIP assays. Ten replicates of a single HIV+ IgG sample were assessed by both assays and the CV is shown for both assays.