Download
1 / 10

E N D
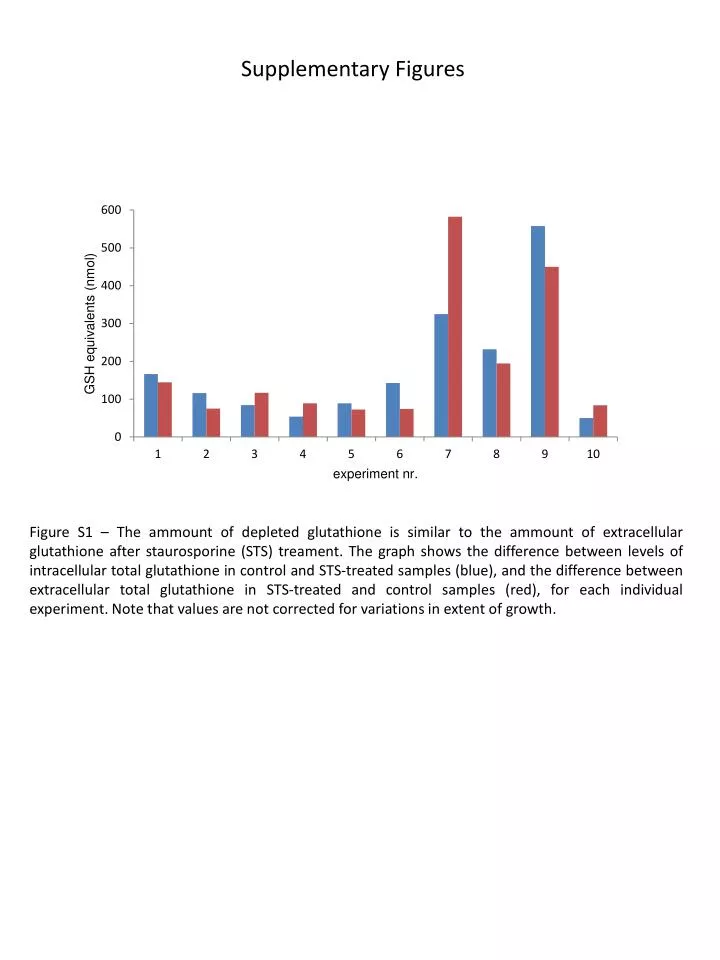
Supplementary Figures Figure S1 – The ammount of depleted glutathione is similar to the ammount of extracellular glutathione after staurosporine (STS) treament. The graph shows the difference between levels of intracellular total glutathione in control and STS-treated samples (blue), and the difference between extracellular total glutathione in STS-treated and control samples (red), for each individual experiment. Note that values are not corrected for variations in extent of growth.
Figure S2 – The cell integrity is preserved under the conditions of staurosporine (STS) treatment that lead to glutathione export. An aliquot of 10 µl of cell culture was stained with 2.5 µg/ml propidium iodide after incubation with vehicle as control (A) or STS (B) prior to glutathione determination. Images were taken in phase contrast (a) or fluorescence for propidium iodide (b) and merged (c), under an epi-fluorescence microscope Zeiss Axio Imager Z1. a c b A a c b B
Figure S3 – Externally added GSH is able to enter N. crassa cells. Intracellular GSH (red) and GSSG (yellow) after 1 h incubation of N. crassa hyphae with 12.5 µM STS, vehicle (DMSO) as control, 10 mM GSH, or STS plus GSH.
A control STS 260 min 105 min 60 min 35 min 22 min 0 DHR 123 DHR 123 B 115 min 60 min 40 min 25 min 10 min 0 control STS DHR 123 DHR 123 Figure S4 - Dihydrorhodamine 123 failed to detect ROS upon N. crassa incubation with staurosporine (STS). The figure shows two independent experiments (A and B). Left – histograms from flow cytometry analyses of dihydrorhodamine 123 (DHR123) oxidation before (0 min) or after incubation of N. crassawith 12.5 µM STS or vehicle, as indicated, for the indicated times. Right – Mean fluorescence intensity (MFI) of oxidized DHR123 from the corresponding experiment.
control STS CHX STS+CHX FL-3 FL-2 FL-2 FL-2 FL-2 Figure S5 – The combination of cycloheximide (CHX) and staurosporine (STS) does not induce loss of plasma membrane integrity under the conditions tested. Dot plots of flow cytometry analyses of of the incorporation of propidium iodide, after 60 min incubation of N. crassa hyphae with 12.5 µM STS or vehicle as control, 5 µg/ml CHX or combination of both, as indicated. The gate shows non-fluorescent, live cells, and respective percentege. The results correspond to one representative experiment.
Figure S6 - Protein synthesis inhibition does not inhibit GSH uptake. Intracellular GSH+GSSG after 1 h incubation of N. crassa hyphae with 12.5 µM STS and 10 mM GSH, in the presence or absence of 5 µg/ml cycloheximide (CHX).
0 11 25 45 60 A DHE DHE DHE DHE DHE B 0 15 40 60 DHE DHE DHE DHE Figure S7 - Dihydroethidium(DHE) failed to detect ROS upon N. crassa incubation with phytosphingosine (PHS). The figure shows two independent experiments (A and B). Top – histograms from flow cytometry analyses of DHE oxidation before (0 min) or after incubation of N. crassa with 10 µg/ml PHS (blue) or vehicle as control (red) for the indicated minutes. Bottom – Mean fluorescence intensity (MFI) of oxidized DHE from the corresponding experiment.
Figure S8 - The toxic effects of H2O2 and menadione in N. crassa growing in solid medium are prevented by GSH while the effect of paraquat is not. Serial dilutions (from left to right) of conidial suspensions of ofN. crassa were spotted and incubated in medium containing the indicated compounds.
Figure S9 – Alignment of protein sequences of N. crassaNCU09012 and human MRP1 (acc. no. NP_004987), performed with Clustal W. Black and grey shadows indicate identical and similar amino acid residues, respectively.
A B Figure S10 – The protein coded by the N. crassa NCU09012 gene is not the main transporter of glutathione upon programmed cell death induction . Extracellular total glutathione (GSH+GSSG) after 1 h incubation of N. crassa wild type or ΔNCU09012 hyphae with 12.5 µM STS (A) , 10 µg/ml PHS (B) or respective vehicles, as control. In A and B, two independent experiments are shown. In A, results represent average ± standard deviation.