Download
1 / 40
420 likes | 586 Views
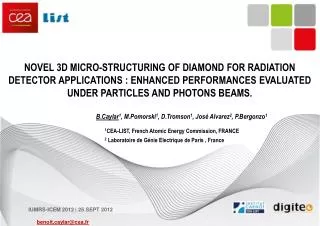
3D micro-structuring of diamond for radiation detector applications. B.Caylar , M.Pomorski , P.Bergonzo Diamond Sensors Laboratory CEA-LIST, Gif-Sur-Yvette, France José Alvarez Laboratoire de génie électrique de Paris (LGEP), Gif-sur-Yvette, France Alexander Oh

E N D
3D micro-structuring of diamond for radiation detector applications • B.Caylar, M.Pomorski, P.Bergonzo • Diamond Sensors Laboratory CEA-LIST, Gif-Sur-Yvette, France • José Alvarez • Laboratoire de génie électrique de Paris (LGEP), Gif-sur-Yvette, France • Alexander Oh • University of Manchester, School of Physics and Astronomy, Manchester, United Kingdom • Thorsten Wengler • CERN, Geneva, Switzerland
Context – Whyusing 3D electrodes? Ionizingparticle 2D Electrodes 3D Electrodes [1] J.Morse, C.J. Kenney, E.M. Westbrook et al. / Nuclear Instruments and Methods in Physics Research Section A, 524 (2004) 236. • Advantages1: • Higher electric field for a given applied bias voltage • Shorter drift path thus drift time • Lower probability of trapping
Context – Whyusing 3D electrodes? • Planar • 3D • Analyticallycalculatedcurrentsgenerated by a MIP
Context – Whyusing 3D electrodes? • NIEL inducesbulkdefects [2] Michal Pomorski – PhD debate, Frankfurt University 07/08/2008 before irradiation after 1.2 x 10¹⁴ 20MeV n.cm-2 after 1.97 x 10¹⁴ 20MeV n.cm-2 Signal decrease • When flux increases : • Defectsnumberincreases • Carrier lifetime reduction • CCE decreases
Context – Whyusing 3D electrodes? • Planar • 3D • 3D geometry is faster : 8ns vs 208ps. • 3D geometry makes the detector more radiation hard
Outline • Burriedelectrodes • Laser setup & Fabrication • Structural characterization • Electrical characterization • pc-CVD Detector (e6 detector grade) • Electrical characterization • Characterization under alpha particles • sc-CVD Detector (e6 electronic grade) • Optical characterization • Electrical characterization • Transientcurrentmeasurements • Conclusion
Burriedelectrodes – Laser setup 20x Lens Sample holder Nitrogen laser λ = 337nm • τ = 3ns Webcam XYZ Motorized stage • Tunableparameters • Scan velocity 1-1000 µm/s • Laser power 0-160µJ/pulse • Repetition rate 1-30 Hz
Burriedelectrodes – Fabrication Translation Graphitization XYZ Motorized stage • Photoluminescence during • laser processing
Structural characterization – Optical microscopy • Optical grade sc-CVD sample 10µm diameter 20-100 µm diameter 700µm depth 150 µm • Clean surface (Where graphitization starts) • Cracked Surface (Where graphitization ends) • Tilted sample
Structural characterization – 2D Raman mapping • 2D Raman depth mapping obtained by integrating diamond peak 1000 CCD cts 1000 CCD cts Depth 0 CCD cts 0 CCD cts 10µm 10µm • No micro-channel • Micro-channelwith cracks
Structural characterization – SEM imaging H2Plasma • Channel’s clean side after H2 plasma • Channel’s clean side after laser processing
Electrical characterization – I(V) measurements A • ρ(average) = 5.7x10⁻¹ Ω.cm • R(500µm) ~ 2kΩ • Match with nanocrystalline graphite given in literature3 [3] T.Ohana, T.Nakamura, A.Goto et al. / Diamond and Related Materials, 12 (2003) 2011 • Graphite’s channel resitivity
pc-CVD detectorElectrical characterization E6 detector grade 10 x 10 x 0.7 mm3 Sample courtesy Alexander Oh
Electrical characterization – Deviceleakagecurrent A • 3D • Planar • Comparisonbetweenplanar and 3D geometry
Characterization under alpha particles – Experimental setup Fast Charge Sensitive Amplifier M.Ciobanu, GSI, Germany Signal Al back contact FCSA Scope Al front contact Collimator R α Vbias = ±500V Am-241 Source 5.486MeV
Characterization under alpha particles - Results • Planar • 3D • Polarization study – Holes drift (pc-CVD sample)
Characterization under alpha particles - Results • Planar • 3D • Polarization study – Electrons drift (pc-CVD sample)
Characterization under alpha particles - Results α α Amplitude has been normalizedwith the signal of a sc-CVD« e6 electronic grade » diamond • Holes drift (pc-CVD sample)
Characterization under alpha particles - Results α α Amplitude has been normalizedwith the signal of a sc-CVD« e6 electronic grade » diamond • Electrons drift (pc-CVD sample)
Characterization under alpha particles - Analysis α HV +500V V/µm 5 4.5 4 3.5 3 High CCE LowCCE 2.5 700µm 2 1.5 1 200µm 0.5 0 α • Electric field simulation 3D Geometry but pseudo–3D detector
sc-CVD detector E6 electronic grade - <100> oriented 3 x 3 x 0.3 mm3 Sample courtesy Eleni Berdermann
Detector’soptical characterization – Optical microscopy Detector area Test areas • Micro structuredsc-CVDdiamondobservedwithcrossedpolarizers • Bulkstrainmappingafter graphitization
Detector’soptical characterization – Optical microscopy • Detector aftermetallization
Electrical characterization – Deviceleakagecurrent • HV on cracked surface • HV on clean surface • sc-CVD sample after plasma O2 etching
Electrical characterization – Setup and methods • Transientcurrentmeasurements HV +100V 2D Zone 2D Zone 300µm Signal Scope Ultra-Fast 40 dB, 2 GHz Broadband Amplifier Ampli
Transientcurrentmeasurements - Results • Withoutcollimator Mixed e/h drift 1 ns Signal 3D~500mV Electrons drift Signal 2D~80mV Holes drift Signal 2D~100mV • Alphas’ injection on cracked side • Alphas’ injection on clean side
Transientcurrentmeasurements - Results • Withcollimator Mixed e/h drift 1 ns • Alphas’ injection on cracked side
Transientcurrentmeasurements - Analysis • Electric field simulation Planar+3D signal +100 V α V/µm 3 2.5 2 1.5 300µm 1 0.5 0 α Planar signal only
Transientcurrentmeasurements - Results • Experimental results Amplitude ratio = 6 • Selection of relevant events
Transientcurrentmeasurements - Results • Analytically calculated signals Amplitude ratio = 23.8 Amplitude ratio = 22 • Theoriticalresponse • 2GHz lowpassfilter
Transientcurrentmeasurements - Results • Analytically calculated signals • Ampli + devicebandwith~350MHz • Rdevice~ 520Ω • 12channelsconnected • Rchannel ~ 6 kΩ Amplitude’s ratio = 6.2 • 350 MHz lowpassfilter
Conclusion • Conductivegraphitic structures has been achieved on both pc- and sc-CVD sample • These structures are suitable for detectors applications • Twodectetorsusing 3D-geometryelectrodes has been produced • A real improvementbetweenplanar and 3D geometry has ben observed • Higher signal • Fasterresponse • « Polarization effect » decrease on pc-CVD detector • But real 3D detector hasn’t been achievedyet…