Download
1 / 20
200 likes | 316 Views
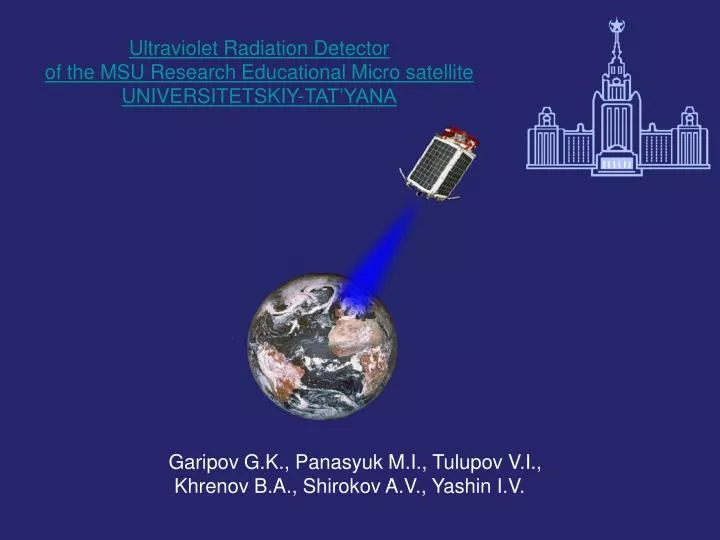
Ultraviolet Radiation Detector of the MSU Research Educational Micro satellite UNIVERSITETSKIY-TAT’YANA. Garipov G.K., Panasyuk M.I., Tulupov V.I., Khrenov B.A., Shirokov A.V., Yashin I.V. Research equipment on the MSU satellite “Tatiana”.

E N D
Ultraviolet Radiation Detector of the MSU Research Educational Micro satellite UNIVERSITETSKIY-TAT’YANA Garipov G.K., Panasyuk M.I., Tulupov V.I., Khrenov B.A., Shirokov A.V., Yashin I.V.
Block-diagram of UV detector at the MSU “Tatiana” satellite UV detector comprises 2 PM tubes and electronics block. (first tube measures an optical radiation, second measures the charge particle background)
UV detector electronics block- diagram. UV intensity is measured by the digital oscilloscope method with time samples different for different tasks. Digital integration is used for selection and registration of various event type. Digital part of circuitry is the FPGA of XILINX type.
1. UV intensity measurements in wide range. 2.UV flashes measurements. 3. Educational program on UV radiation is based on the date observed in TAT’YANA experiment in both of this topics.
The intensity starts to be measured when satellite went from day to night side of the Earth and DAC code exceeds 90. When satellite comes out of the Earth shadow the measurements are continued for 2 min.
*Monitoring of UV intensity on-route. Time between measurements is 4 sec. Integration time in every point is 64 ms. Two code are recorded and used in measurements: M- PMT voltage DAC code and N- the ADC code
Examples of UV intensity recording on – route in moonless night in two circulations. .
Examples of UV intensity recording on – route in full moon night in two circulations. .
Examples of UV intensity and AURORA (A,B) recording on – route at North latitudes in moonless night in two circulations.
Examples of UV intensity and AURORA (A,B) recording on – route at South latitudes in moonless night in two circulations.
Conclusion 1. 1. The “Tatiana” UV detector confirm the values of UV intensity at moonless local nights known from the previous measurements from space and balloons. 2. Minimal intensity observed in moonless night is 2×10⁷ photons/cm2 ×sec × sr, maximal – 108 photons/cm2 × sec × sr. 3. AURORA in South and North latitudes have been registered, maximal intensity 30 time exceeds airglow in moonless nights. 4. We do not find extraordinary UV light excess above the industrial centers. City light in UV is 2-3 times larger the UV intensity over ocean at moonless night.
*Registering of short UV flashes. It performed by 2 oscilloscopes: with trace length 4 ms and time sample 16μs, and trace length 64 ms and time sample 256μs.
Examples of UV flashes of energy 1011 – 1012 erg in 1-64 ms intervals were detected.
UV flashes are concentrated in the equatorial region. Their energy and time duration are similar to an observed in equatorial region special kind of discharge- a “sprite”.
UV flashes does not correlate with active thunderstorms lighting regions
Conclusion 2. 1. UV flashes of energy 1011– 1012 erg in 0.1-64 ms intervals were detected. They are concentrated in the equatorial region. Their energy and time duration are similar to an observed in equatorial region special kind of discharge- a “sprite”. 2. UV flashes are more frequent above oceans in regions where thunderstorm lighting should be rare.
Geographical distribution of the UV flashes of TAT’YANA experiment. Geographical distribution of the ray flashes of the RHESSI experiment.
Conclusion 3. • 1. In our opinion all of the observed phenomena in atmosphere should be considered in connection they are tied up and are connected with the Sun activity via solar radiation, winds and earth radiation belts. • 2. First step for confirmation of that opinion is in progress and based on the results of the TAT’YANA UV radiation and particle detectors.