Download
1 / 21
210 likes | 323 Views
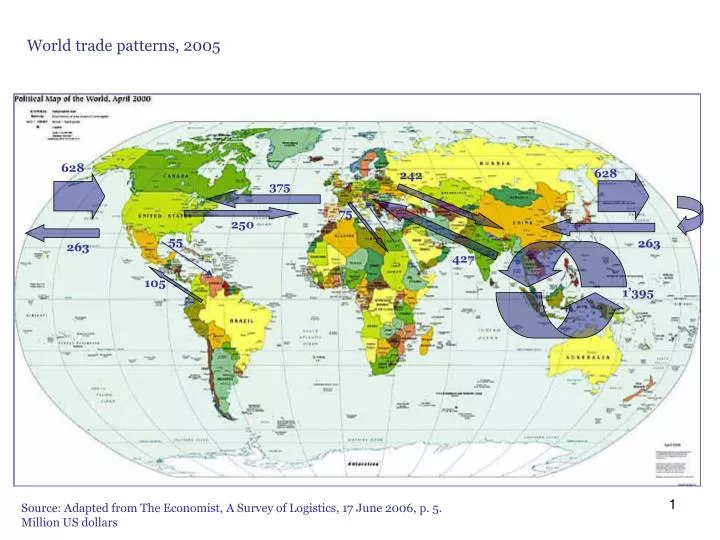
World trade patterns, 2005. 628. 628. 242. 375. 75. 250. 55. 263. 263. 427. 105. 1’395. Source: Adapted from The Economist, A Survey of Logistics, 17 June 2006, p. 5. Million US dollars. The world’s shifting economic center of gravity. 2015.

E N D
World trade patterns, 2005 628 628 242 375 75 250 55 263 263 427 105 1’395 Source: Adapted from The Economist, A Survey of Logistics, 17 June 2006, p. 5. Million US dollars
The world’s shifting economic center of gravity 2015 Source: JM Grether and N Mathys (2006), “Is the World’s Economic Center of Gravity Already in Asia?”, mimeo, Univ. of Lausanne
L’avantage comparé: example de base (Ricardo) • Postulats • Deux pays (Portugal et GB) • Deux industries (vin et tissu) • Un facteur de production (travail), • Rendements à l’échelle constants • Pas de coûts de transport • Pas d’intervention gouvernementale • Concurrence parfaite (prix = coût)
Frontière des possibilités de production: Portugal Vin Courbe d’indifférence 40 Point de consommation en autarcie FPP (Frontière des possibilités de production) Tissu 20
FPP de l’Angleterre Wine FPP Point de conso en autarcie 20 Courbe d’indifférence Courbe d’indifférence Drape 40
The gains from exchange revisited Wine Indifference curves Production Possibility Frontier world price ratio Drape
Les gains de la spécialisation Wine Production point Indifference curves world price ratio Production Possibility Frontier Drape
Le théorème de Rybszinski Acier Effet des investissements étrangers FPP initiale Effet de l’immigration Textile
vente Ligne des prix Bien y Achat Achat vente Dotation initiale Bien x Digression: La ligne des prix
Prix relatif d’autarcie Le théorème d’Heckscher-Ohlin point de production après l’ajustement structurel Courbe d’indifférence steel Prix relatif sur le marché mondial (tissu moins cher) home steel exports point de conso après l’AS “trade triangle” PPF drape home drape imports
Les gains de l’échange (i): équilibre initial P S* P S P*a Pa D* D Quantities Country H (relatively efficient) Country F (relatively inefficient)
a b c d Equilibrium price Method 1: Equate segments ab and cd P P* Country H Country F P*a Pw Pa
Equilibrium price Method 2 a) Construct excess supply (ES) and excess demand (ED) curves Home ES ab = cd a b c d Pa Export supply Pa* ab = cd a b c d Foreign ED* Import demand
Equilibrium price, method 2 b) Match the home ES and foreign ED curves on single « world » market S* Pa* ES P*a S Pw D* Pa ED* D Quantities E=M* Country H (exporter) Country F (importer) « World » market
Gains from goods trade Importer country consumers’ gain, producers’ loss = neutral P A B K C pa F J p* World price G H I D ED (a) Importer country’s domestic market (b) same thing seen on world market
Gains from goods trade Exporter country producers’ gain, consumers’ loss = neutral A ES F p* E H G D World price B C I pa EF (a) Exporter country’s domestic market (b) same thing seen on world market
+ = PIB (égal au PNB qd le capital ne bouge pas) Gains de la mobilité du capital Point de départ: pas de mobilité Produit marginal du capital r Stock de capital de l’économie Very similar to trade in G&S: Identical causes: differences in prices (factor rewards) Identical consequences: some gains, other loose, and there is a net potential gain. Paiments aux autres facteurs ra Paiments au capital K
Gains de la mobilité du capital Flux de capitaux vers l’étranger Deux pays, H bien doté en capital. Initialement, rH < rF, : le capital va migrer de H vers F VF = p*F*K VH = pFK A l’équilibre, le produit marginal du capital est égalisé dans les deux pays. Gains from capital movements: EBCfor H, EIBfor F. A I rF E rW B D G C rH Stock de capital national (avant sortie de capital) Stock de capital étranger (avant entrée) Expansion du stock de capital étranger (à cause de l’entréee)
PIB national PIB étranger Gains from factors trade GNP vs. GDP, efficiency gain VF=p*F*K VH=pFK PNB étranger PNB national Gain d’efficacité du au mouvement des capitaux