Download
1 / 48
480 likes | 488 Views
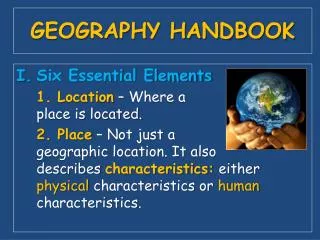
Geography Skills Handbook. Essential Vocabulary and Map Reading Skills. Why is this Important?.

E N D
Geography Skills Handbook Essential Vocabulary and Map Reading Skills
Why is this Important? • Geography skills provide the tools and methods for us to understand the relationships between people, places, and environments. We use geographic skills when we make daily personal decisions -where to buy a home; where to get a job; how to get to the shopping mall; where to go on vacation.
Why is this Important? • Community decisions, such as where to locate a new school or how to solve problems of air and water pollution, also require the skillful use of geographic information.
Why is this Important? • This Geography Skills Handbook introduces you to the basic geographic tools-globes, maps, graphs-and explains how to use them. These resources will help you get the most out of your geography course-and provide you with skills you will use for the rest of your life.
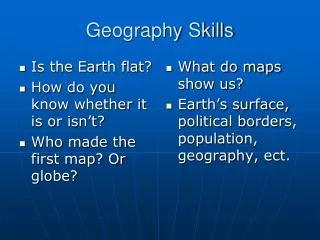
Latitude, Longitude, and Location • Geography is often said to begin with the question: Where? Although this question can be answered in many ways the basic tool for finding the answer is location. Lines on globes and maps provide information that can help you locate places. These lines cross one another, forming a pattern called a grid system. This system helps you find exact places on the Earth’s surface.
Latitude: • Parallels: Parallel to the Equator, measure the distance north and south of the Equator in degrees. Equator measured at 0° latitude, the poles are 90 ° N and 90° S. • North latitude: Parallels north of the Equator • South latitude: Parallels south of the Equator
Longitude: • Meridians: Circle the Earth from Pole to Pole. Run east and west of the Prime Meridian. • Prime Meridian: Line of longitude that runs through the Royal Observatory in Greenwich, England. • East longitude: Places east of the PM • West longitude: Places west of the PM
The Global Grid • Absolute location: A global address where latitude and longitude lines cross exactly at that place. • Example: Tokyo, Japan is located at 36°N latitude and 140°E longitude. • Minutes: Give a more precise reading; each degree of latitude and longitude is subdivided into 60 units.
So How Do I Read a Global Grid? • Just like a graph in math class. • Why is this grid no good?
From Globs to Maps • A globeis a scale model of the earth. Because the earth is round, a globe presents the most accurate depiction of geographic information such as area, distance, and direction. However, globes show little close-up detail. • A printed map is a symbolic representation of all or part of the planet on a flat piece of paper. Unlike globes, maps can show small areas in great detail. Another advantage of printed maps is that they can be folded, stored, and easily carried from place to place.
From 3-D to 2-D • Cartographers: Mapmakers • Issues: When the curves of the globe become straight lines on a map, distortion of size, shape, distance, or area occurs.
How Map Projections Work • Map Projections: Purpose of the map dictates which style is used. Planar Cylindrical Conic
Common Map Projections • The curved surface of the earth cannot be shown accurately on a flat map. Every map projection stretches or breaks the curved surface of the planet in some way as it is flattened. Distance, direction, shape, or area may be distorted. • Cartographers have developed many map projections, each with some advantages and some degree of inaccuracy. Four of the most popular map projections, named for the cartographers who developed them, are shown below.
NG official projection Good size/shape balance Polar areas distorted Winkel-Tripel Projection
Developed before the Winkel-Tripel Minor distortions, poles are very distorted Robinson Projection
Good to show data True size/shape of landmasses Distance distorted Goode’s Interrupted Equal-Area Projection
Useful for sea travel Further from equator, become extremely distorted Shows true size/shape of landmasses Mercator Projection
Reading A Map • In addition to scale and the lines of latitude and longitude, maps feature other important tools to help you interpret the information they contain. Learning to use these map tools will help you read the symbolic language of maps.
Every map has different symbols, to assure that the symbols used are clear every map contains a key; a list that explains what the symbols stand for. Key/Legend
On political maps boundary lines highlight the borders between different countries, states, or counties. Boundary Lines
A marker to indicate direction Cardinal Directions: N, S, E, W Intermediate Directions: NE, NW, SE, SW Compass Rose
Shows the relationship between map measurements and actual distances. Scale Bar
Represented by dots. Relative sizes of cities can be used by using dots of different size. Cities
National capitals are often represented by a star with in a circle. Capitals
Small-Scale Maps • A small-scale map can show a large area but little detail. Note that the scale bar for this map indicates that about ½ an inch is equal to 200 miles and about 300 kilometers.
Large-Scale Maps • A large-scale map can show a small area on the earth’s surface with a great amount of detail. Note that map measurements correspond to much smaller distances than on a small-scale map.
Absolute and Relative Location • As you learned before, a place’s absolute location is found at the precise point where one line of latitude crosses a line of longitude. Another way that people indicate location is by relative location. You may be told, for example, to look for a street that is “two blocks north: of another street. Relative location is the location of one place in relation to another place.
Absolute and Relative Location • To find relative location, find a reference point—a location you already know—on a map. Then look in the appropriate direction for the new location. For example, locate Houston (your reference point) on this map. The relative location of Dallas can be described as northwest of Houston and Galveston can be described as southeast of Houston.
Types of Maps • Maps are prepared for many uses. The use for which a map is intended determines the kinds of information it contains. Learning to recognize a map’s purpose will help you make the best use of its content. • General Purpose Maps: • Used for reference, education, and travel. There are 2 main types:
Physical Map • Shows location and the topography, or shape, or the earth’s physical features. Physical maps use colors or patterns to indicate relief—the difference in elevation, or height, of landforms. • These physical features often help to explain the historical development of a country.
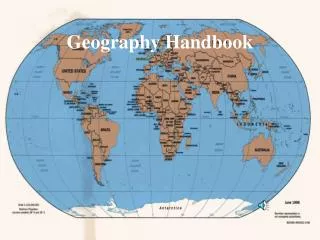
Political Map • Shows the boundaries between countries. Smaller internal division, such as states or counties, may also be indicated by different symbols. • Political maps often show human-made features such as capitals, cities, roads, highways, and railroads.
Special Purpose Maps • Maps that emphasize a single idea or a particular kind of information about an area are called special-purpose maps. There are many kinds of special-purpose maps, each designed to serve a different need: relief maps, climate maps, population density maps, vegetation maps, elevation profiles, economic activity maps, and cartograms.
Graphs, Charts, and Diagrams • In addition to globes and maps, geographers use other visual representations to display and interpret data. Graphs, charts, and diagrams provide valuable information in forms that are well organized and easy to read.
Graphs • A graphis a visual representation of information. There are many kinds of graphs, each suitable for certain purposes. Most graphs show two sets of data, one displayed along the vertical axis and the other displayed along the horizontal axis. Labels on these axes identify the data being displayed.
Line Graph • Shows change in two variables or changing sets of circumstances over periods of time. • To analyze data on a line graph, study the changes and trends as shown by the line.
Bar Graph • Shows comparisons. To analyze a bar graph, note the differences in quantities.
Circle Graph • Also called a pie chart, shows the relationship of parts to a whole. • Percentages are indicated by relative size and sometimes by color. • To analyze a circle graph, study the relationships of areas to one another and to the whole.
Charts and Tables • Data are arranged in columns and rows in a chart or table. Charts and tables display facts in an organized manner and make comparisons easy. To find key information in a chart or table look for the intersections of columns and rows.
Diagrams • A diagram is a drawing that shows what something is or how something is done. Many diagrams feature several drawings or sections that show the steps in a process.