Download
1 / 16
160 likes | 164 Views
Warm-Up Solve the following Inequalities: 1. 2. 3. Warm-Up Answers 1. 2. 3. Lesson 6.2 Graphing Inequalities In Slope-Intercept Form. It could be greater than ( > ) or less than ( < ) or ( > ) or ( < ). Graphing linear inequalities with 2 variables.

E N D
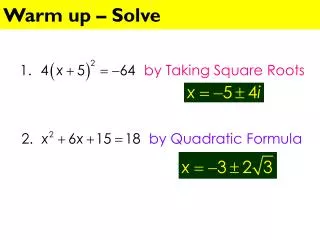
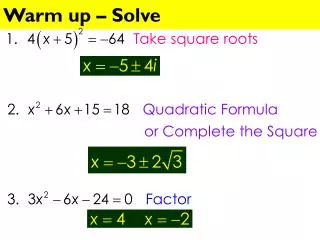
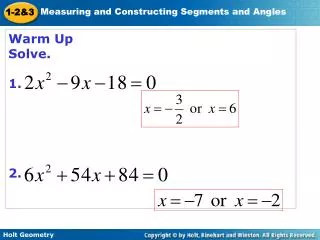
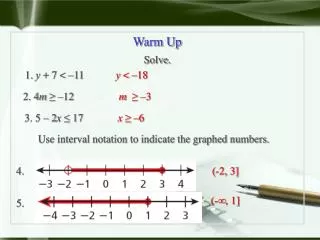
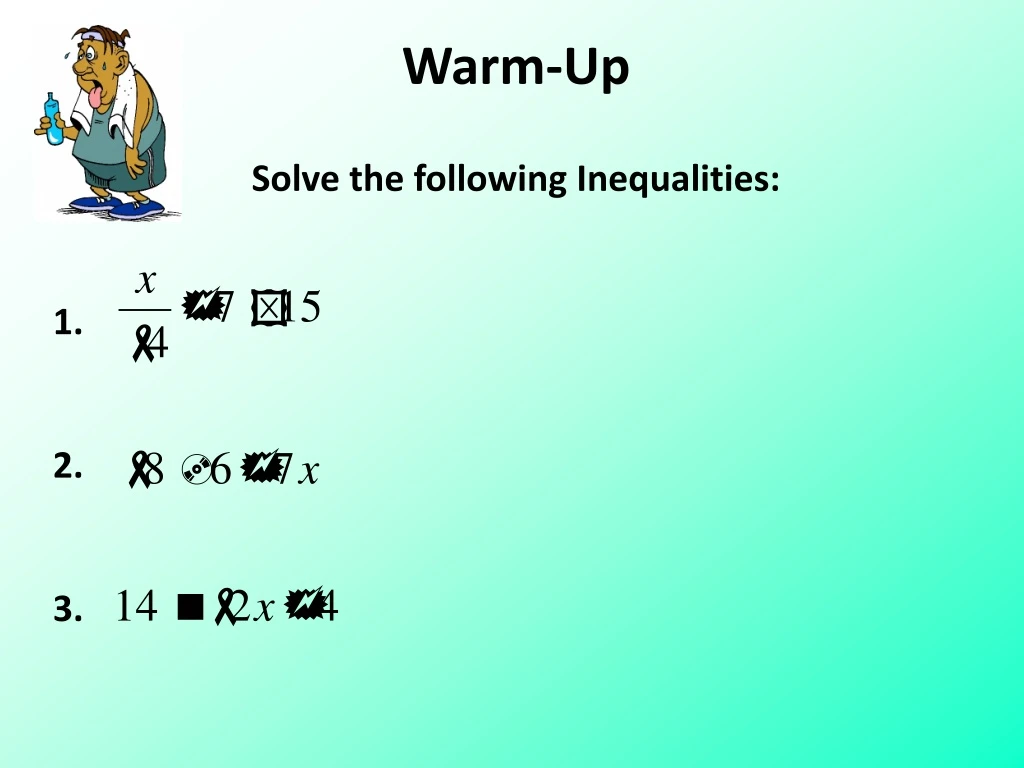
Warm-Up Solve the following Inequalities: 1. 2. 3.
Warm-Up Answers 1. 2. 3.
Lesson 6.2 Graphing Inequalities In Slope-Intercept Form It could be greater than (>) or less than (<) or (>) or (<).
Graphing linear inequalities with 2 variables The graph of the solutions to a single inequality is called a ____________ because it includes all the points in the coordinate plane that fall on one side of the __________ line. half-plane boundary boundary
To Graph an Inequality: You must follow these 5 steps: 1. Put in y = mx + b form. 2. Find m and b. 3. Decide if the line is solid or dotted. <, > dotted line <, > solid line • Graph using your m and b • Shade above or below the line using: Test Point Method! (0, 0) is the easiest! But we cannot always test this point so we have to find another point that is clearly above or below the line. If the point you plug in makes a TRUE statement, shade where that point is included. If the point you plug in makes a FALSE statement, shade away from that point.
Example 1: m =-2/3 b = (0, 2) 1. Find m and b. • Is the line dotted or solid? Dotted line 3. Next, let’s graph so can pick a test point to try!
Use (0, 0) as a test point, and plug into the formula Is this a true statement? NO! Which means we shade AWAY from that point…
Example 2: 1. m = ¼ 2. b = (0, 3) • Solid Line • Test Point (0, 0) Which is true so shade where that point exists!
Try this one on your own! Example 3: y < – 3x + 1 m = b = (0, ) Dotted or Solid Line? Test Point?
Lesson 6.3 Solving and Graphing Inequalities in Standard Form
You have two options for graphing in standard form. • Solve for y by getting into slope intercept form. • Plug in your zeros to get x and y intercepts (assuming equal sign). • Then use a test point on either side for shading.
Ex. 4 2x + y < 4 -2x -2x Easily Solve for y Graph the y intercept (0,4) Now, graph two more points using the slope (m=-2) Draw a dotted line through the points (It is dotted because there is not an = sign under the inequality) Pick a test point to see which side of the line to shade. Let’s use (4, 5) Plug the ordered pair into the original equation 5<-2(4) + 4. Is this true? Only shade the true side. Since this false we will shade the other side of the line
Ex. 5 -2x -2x -4 -4 Pick a test point to see which side of the line to shade. Let’s use (0, 0) Plug the ordered pair into the original equation. Is this true? Only shade the true side.
You try! Ex. 6 Ex. 7
Summary/Reflection How will you remember when to use a solid or dotted line? and How will you remember where to shade on a linear inequality?
ClassworkWorksheet 6.2-6.3 Homework Worksheet 6.2-6.3